Introduction
Since February 2022, following the start of Russia’s special military operation in Ukraine, the global geopolitical space has been suffering from deglobalisation processes unfolding amid the hybrid war of civilisations. One of the key tools of the hybrid war is international economic sanctions (IESs) applied against the countries opposing Western civilisation, such as North Korea, Iran, Venezuela, and now Russia. Partially, IESs are imposed on China as well. By applying such penalties, the Western nations aim to weaken these states and force them to accept ‘global standards’ of behaviour in the international arena. The use of sanction policy contributes to the accumulation of details about the effectiveness (or ineffectiveness) of IESs against the named countries. This raises the question of assessing the vulnerability of national economies to IESs or, taken more broadly, their fragility with respect to external constraints.
The relevance of the stated issue is due to the fact that in the period of 2022–2023, despite facing 10 packages of economic sanctions and becoming the most sanctioned economy in the world, the Russian Federation has managed to avoid the shocks that Western experts were counting on. However, it may happen that the projected shocks are just postponed for the next two or three years. Questions like these bring to the forefront the problem of quantifying the self–sufficiency of the national economy of Russia and other countries. It is the quality that allows the states experiencing the sanction pressure to follow the political course of their choice and be effective in reconfiguring their economies amid adverse conditions.
The purpose of the present study is to develop a method for assessing the antifragility of the national economy and test it using the sample of several countries. The spatiotemporal pattern of the economy antifragility index will help to (1) identify vulnerable countries suffering the maximum damage from the disruption of the international economic ties and (2) point to those that have boosted their economic independence over the past decades or turned into helpless ‘cogs’ in the world economic systems.
Literature review and relevant examples
Due to the global financial crisis of 2008–2009, the concept of resilience, which was previously used in medicine, engineering and natural sciences to evaluate the ability of systems to resist shocks, return to an equilibrium state and adapt to economic processes, has become increasingly widespread in economics [Simmie, Martin, 2010; Briguglio et al., 2009]. However, studies on assessing economic vulnerability appeared long before that. A significant part of them were focused mainly on revealing countries’ ability to withstand various natural disasters and recover from their consequences [Kliesen, 1994; Peduzzi et al., 2009; Chang, Rose, 2012].
Empirical works on constructing an economic vulnerability index were premised on the fact that exposure to external shocks is interrelated with economic characteristics, such as the degree of economic openness expressed as the ratio of a country’s international trade to its GDP; export concentration calculated through the goods and services trade index; and strategic import dependence measured by the ratio of imports of energy, food and manufactured goods to GDP [Briguglio, 1995; Briguglio, Galea, 2003].
Using the economic resilience index calculated through composite indicators of economic stability, macroeconomic market efficiency, the quality of governance and social development, as well as the economic vulnerability index [Briguglio, Galea, 2003], more recent publications distinguished between four groups of countries according to the combination of economic resilience and economic vulnerability [Briguglio et al., 2009]:
– Best Case: high resilience / low vulnerability (Australia, Canada, the USA, Italy, Japan, Switzerland, etc.);
– Self–Made: high resilience / high vulnerability (Norway, Singapore, Luxembourg, Latvia, Estonia, Barbados, etc.);
– Prodigal Son: low resilience / low vulnerability (Albania, Brazil, China, India, Pakistan, Romania, Russia, Turkey, etc.);
– Worst Case: low resilience / high vulnerability (Iran, Venezuela, Egypt, Uganda, Nicaragua, etc.).
In addition to the above attempt to build and analyse the economic resilience index of a region, a lot of research have been carried out to evaluate an immense number of indicators affecting it. Concretely, an array of factors were investigated, including the export structure and the share of developed economic markets in it [Vega, Elhorst, 2014], the topological structure of supplier–manufacturer networks [Xu et al., 2019], the presence and the amount of natural, physical and human resources [Giannakis, Bruggeman, 2017], the structure of economic activity [Christopherson, Michie, Tyler, 2010] and the role of the service sector in this activity at the regional level [Navarro–Espigares, Martín–Segura, 2012], infrastructure, innovation, skilled workforce, an adequate financial system [Di Caro, 2015].
Conducted research have shown that the regions with increased economic diversity are the most resilient ones [Nistotskaya, Charron, Lapuente, 2015]; narrow specialisation in certain domains negatively affects the indicator under consideration [Capello, Caragliu, Fratesi, 2015]; the influence of the manufacturing sector is most significant at the stage of strengthening the economy’s ability to resist shocks, while the service sector becomes especially important during the economic recovery after experienced shocks; agriculture, physical capital, and population size have a weak impact on resilience [Oprea et al., 2020]. In addition, the analysis indicated that countries with extensive business networks and a coherent exchange rate policy, such as the United States and China, are the most resilient to external shocks, while South African countries are the most vulnerable due to the weak structure of the industrial topology [Duan et al., 2022]. Thus, it is the involvement in global industrial chains and the structural diversity of the economy that are among the key criteria for its sustainability.
The theoretical core of the IES policy is the global nature of the world’s economic system and strong relationships between all states. The fact that all countries of the world are involved in the existing international value chains makes it possible to exclude some of them from this global process and thereby inflict massive damage on them or even trigger a complete economic collapse. While this thesis is theoretically sound, in practice, it is hardly workable. For instance, neither Iran, nor North Korea, nor Venezuela have changed their political course after they had been exposed to IESs. Moreover, they have reconfigured their economies with the special focus on self–sufficiency and are confidently moving along the path of economic, technological and social progress [Malakhov, Yurevich, Aushkap, 2018]. Something of the kind is still happening in Russia. At the same time, the events of 2022 showed that IESs against the Russian Federation also had an unpredictable outcome – they gave rise to enormous problems in the European countries. This fact in itself brings up numerous questions. Some of them are Why did the EU countries with the average level of labour productivity twice as big as that in Russia turn out to be more vulnerable to IESs? Why did more technologically advanced nations find themselves so heavily dependent on a ‘resource appendage’ of the world system? Isn’t the structure of the EU economy initially lop–sided in certain areas? And why was the US economy also doing not so well during this period?
The most superficial and obvious answer is the distortion of the ‘natural’ structure of the national economy towards non–productive industries, such as the hypertrophied entertainment industry [Voronina, 2021]. Being widespread, it undoubtedly makes a significant contribution to the country’s gross value added (GVA), but does not make the economy any stronger. The striking examples of ‘idle’ results in the non–productive industry are two boxing fights in the USA – Floyd Mayweather vs. Manny Pacquiao in 2015 and Floyd Mayweather vs. Conor McGregor in 2017. In total, the first fight generated 600 million US dollars, and the second one – 550 million US dollars [1]. In fact, this means that the boxing matches increased the US GDP by 1.2 billion US dollars, while they had no real effect on the material sphere. A large volume of GDP or GVA as such does not reflect the strength of the national economy and its ability to withstand external challenges. If a country in the world market trades in movies and purchases foods, then the rupture of business ties would result in starvation of its population. This case can serve as a reference point for further reasoning and computational procedures, as the one illustrating that various activities and entire economic sectors can be both constructive and destructive, depending on the situation.
The author and ideologist of the concept of antifragility is Nassim Taleb, who coined the term, provided it with a meaningful interpretation, defined it mathematically, and substantiated the role of heuristic methods for studying this phenomenon [Taleb, 2014]. In accordance with the principles of word formation, antifragility should be understood as a property that is the opposite of fragility. As we put it, antifragility is an ability of a system to resist destructive external influences and reorganise itself amid this struggle towards its enhanced functionality in comparison with the initial level. IESs act as a stressor for the national economy and give rise to a bifurcation of its further existence, i.e., either destruction or strengthening. It is noteworthy that sanctioned countries had initially protested against the established world order and sought to go beyond its limits. Some of them succeeded. For example, North Korea and Iran, having survived the decades–long burden of the IESs, now have political, economic and technological sovereignty and claim a special status in the geopolitical space. Today, Russia is following this path: it will take much longer to get the final outcome; however, the very fact of bifurcation is obvious.
In reality, it is rather problematic to measure the antifragility of the economy, but indirect assessments that are very close to this concept have long been on the economic agenda. For example, in 2003–2007, a series of works was published proposing an export complexity index to assess the level of technological development of the national economy [Hausmann, Rodrik, 2003; Bergsten et al., 2006; Rodrik, 2006; Hausmann, Hwang, Rodrik, 2007]. In 2018, Bristlecone, Ltd. developed the Antifragility Index, that is a comprehensive measure of how vulnerable global companies’ supply chains are to outside threats [2].
In the preface to the book by Bergsten et al. [2006] about China as a ‘nascent superpower’, Popov gave a concise and accurate description of this analytical construction: first, a weighted average GDP per capita for exporters of a certain product (out of 5,000 possible product items) is calculated, and thereby per capita income in a hypothetical country that specialises in exporting this product only is measured; then, the same hypothetical level of GDP per capita is computed for a country with a given export structure and compared with the country’s actual GDP per capita. This juxtaposition was found to be highly informative for explaining economic growth. For example, the gap between the hypothetical and actual level of GDP per capita in China in 1992–2003 reached its maximum (3 to 6 times), which signified that the structure of Chinese exports was equivalent to one in a country that would be several times ahead of China in terms of GDP per capita.
Such calculations show the genuine technological power of the state and its capabilities to execute production manoeuvre, specifically in the context of autarky. Interestingly enough that the logic of the export complexity index was subsequently extended to imports and the entire economy in order to construct the relevant largescale rankings of the countries of the world [3]. Meanwhile, it is obvious that economic complexity indices reveal the potential production capabilities of different countries in the global economic system, but do not help to comprehend their ability to withstand the rupture of external relationships.
In the field of national security, which is among the significant research domains dealing with the power and resilience of states, publications by Shumov [2015, 2016] is worth special attention. He concentrates on modelling and evaluating such a phenomenon as the security function of the state, which is the product of the sovereignty (development) function and the preservation (reliability) function of the state. The sovereignty function is, in turn, approximated by the geopolitical potential of the state, which depends on the country’s share in global indicators in the territorial, demographic, economic and military spheres [Shumov, 2016, p. 12]. The social technologies index is used as an auxiliary quantity in the calculations, which is measured based on GDP per capita indicators, the share of the urban population, and the population growth in the country [Ibid., p. 15]. Using these constructs, the historical reconstruction of the Roman Empire’s security dynamics was presented, including the Roman Republic from 200 BC to 400 AD [Ibid., p. 88], as well as the Russian Empire, inclusive of the USSR and the Russian Federation between 1500 and 2009 [Ibid., p. 95]; a comparative security dynamics of imperial formations, such as the United Kingdom, the USA, China and Russia was obtained for the time period of 1700–2009 [Ibid., p. 114]. However, all the methods under consideration aim to grasp long–term patterns and are not designed to assess IESs–like local shocks having a five–year effect.
One of the latest and, undoubtedly, the most important and influential works on the topic is Ray Dalio’s book on the cycles of the world order [Dalio, 2023]. The author has compiled a generalised index of wealth and power of the country, which is a roughly equal average of its 18 determinants, i.e., private indices relating to the following spheres of life: capital market; internal order (within the country); external order (between countries); education; innovation and technology; cost competitiveness; military strength; the state of trade; economic output; financial centre strength; reserve currency status; geology and geography; resource allocation efficiency; acts of nature; infrastructure and investment; character / civility / determination; governance and rule of law; gaps in wealth, opportunity and values [Dalio, 2023, p. 67]. However, a detailed description of the calculation method and initial data are only provided on Ray Dalios website, along with extra materials given in response to individual user requests. Some of the indicators used by Dalio are calculated in the traditional way, while others – on the basis of expert assessments. The author identifies the cycles of the world order for 11 leading empires for the period between the years 600 and 2000 and puts a special emphasis on the dynamics in the Netherlands, the United Kingdom, the USA, China and Russia starting from the 16th century. It should be noted that the cycles of the world order for the Netherlands, the United Kingdom and the USA correspond to Giovanni Arrighi’s systemic cycles of capital accumulation [Arrighi, 2006] and can be used to refine their chronology. At the same time, similar to the studies on the national security of states, Dalio’s cycles are intended to identify long–term patterns; they do not cover short–term effects caused by external IESs–like shocks.
Studies on the probability of defaults fall within the same research framework. For instance, the leading international rating agencies are actively utilising their own methods to compile official sovereign risk ratings of different countries that display some elements of subjectivity and bias inherent in them. A variation of this toolkit is the so–called ‘technical’ method for estimating the probability of sovereign defaults. Using the actual 2015 data for the United States, this method indicated that in that year the world hegemon was already three times the actual bankrupt by the standards of Latin America’s defaults history and seven times – by the Asian standards [Balatsky, 2016]. Such a discrepancy between theory and practice is due to the privileged position of the United States in the global market, but at the same time it reveals the true position of the number–one economy and its low ability to equalise its financial imbalances.
Thus, despite the fact that there are a significant number of studies on economic resilience, the question of its assessment remains unresolved. Moreover, the recent events have shown that common indices and indicators are inapplicable to the current situation, which makes it necessary to discover new algorithms for evaluating the antifragility of the economy. The following sections of the article are devoted to tackling this problem.
A heuristic algorithm for evaluating the antifragility of the economy
The core idea of the algorithm being developed lies in selecting a number of industries, which are of the highest priority for the national economy in terms of maintaining it in a healthy and stable state. The economy with large enough shares of GDP (GVA) of such industries in its structure will be able to switch to the self–sufficiency regime and continue normal functioning within a reasonable period (about 5 years) if international relations are severed. Otherwise, the economy is too fragile and it cannot function autonomously due to the lack of the vital goods supplied by the priority industries.
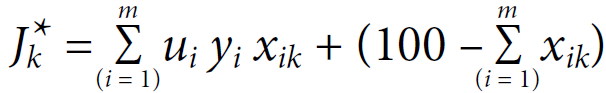
It is quite logical to introduce special multiplying coefficients of significance for these industries’ shares, which will take into account their state in order to maintain the reproduction mode of the national economy. If xik is a share of the i–th industry in GVA of the k–th country (in percent), then the primary version of the antifragility index of the k–th national economy (Jk) can be represented as follows:
 (1)
(1)
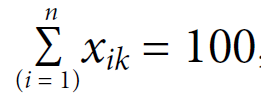 (2)
(2)
where m is the number of the priority industries; n is the total number of industries; condition (2) is the usual normalisation condition; ui is multiplying coefficients of significance for the priority industries; yi is a normalising factor for the i–th industry. In formulas (1) and (5), asterisks (*) designate the first and second intermediate versions of the antifragility index, respectively.
Coefficient yi needs some elaboration. Since in reality the shares of the priority industries can differ substantially, it is not enough to introduce a linear scale of multiplying coefficients to take into account their impact. To do so, the shares are additionally normalised according to the following rule:
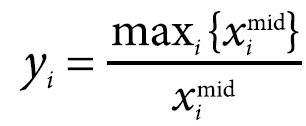 (3)
(3)
where ximid is the average share of the i–th industry for all countries.
Analysis of the index (1) structure shows that only the priority industries carry a semantic load, while the rest can be neglected. Simultaneously, an extra coefficient should be introduced to the index that reflects the level of prosperity and technological development achieved by the country. This is due to the fact that the same share of the industry for different countries means a completely different absolute level of production of the corresponding products. To take this circumstance into account, it is sufficient to multiply aggregate (1) by the following coefficient:
 (4)
(4)
where zk is GDP per capita of the k–th country by purchasing power parity. Then, index (1) takes the form as follows:
 (5)
(5)
In its final form, the antifragility index of the k–th national economy (Jk) should take into account a priori normalisation using an additional calibration coefficient α:
 (6)
(6)
The lower limit of the index is defined at xik = 0 for all i and takes on the value 0. If we proceed from the assumption that the upper limit of the antifragility index is 10 (points) and achieved with the maximum possible industry shares xik for all countries in the world’s richest economy, then the calibration coefficient a can be calculated by formula:
 (7)
(7)
where t is the index of time (year); the index Jk from equation (6) enters equation (7) with the value 1, since a is calibrated according to the richest state; if calculations are performed for a number of years, then the maximum industry shares are determined for the entire study period, which is reflected in the introduction of the time index t; yi,mid is the normalising coefficient for the i–th industry in its mid–value for all countries and the entire period of the study.
Thus, the antifragility index of the national economy falls within the range of 0 < Jk < 10.
With construct (6) established, priority industries should be identified. To do so, we will proceed from the following considerations.
The first and most important industry of the national economy is the agriculture, which embraces agriculture, forestry, and fishery (section A of the OKVED–2 [4] classification). Clearly, the lack of foods puts the survival of the country’s population on the agenda, and geopolitical issues in this case are relegated to the background. Hence, agriculture is a fundamental element of the economic sovereignty of a state, and failures in its functioning make the national economy extremely vulnerable to all types of external economic pressure. In this regard, it is worth mentioning that since 2020, due to the closure of the border with China and the cessation of food supplies from there, North Korea has been experiencing some signs of a food crisis [5]; the problem is also exacerbated by typhoons and other natural disasters.
The second industry that is of strategic importance for the survival of the population is the manufacture of means of labour (production), i.e., machinery and equipment not included in other groups (industry position S28 of the OKVED–2 classification; section D 29–29.6 until 2011). Here, it is referred to the ability of the nation to provide itself with the minimum of means of labour adequate for performing subsequent production activities. Otherwise, undersupply of components will automatically lead to paralysis of most industries of the national economy.
The third strategically important industry for the economy is mineral extraction (section V of the OKVED–2 classification; section S until 2011). Contrary to the prevailing opinion about the primacy of high–tech manufacturing industries, it is obvious that the lacking minimum of natural resources makes it impossible to launch all other types of production. Insufficiency of energy resources, raw materials and supplies will make it impossible for the country to continuously resist an economic blockade.
And finally, the fourth industry which can be listed as a priority one is pharmaceuticals (industry position S21 of the OKVED–2 classification). The sufficient amount of this industry’s goods, such as various forms of medicines, is the key to ensuring public health in the medium term. In case of a shortage of these products, there emerges a risk of increased mortality due to even minor and preventable diseases.
Naturally, the core of the four priority industries of the economy is identified on the basis of extremely simple reasoning, which is subject to criticism. However, we believe that the key issues of life support should not be founded on complex theoretical constructions, which justifies the use of simple heuristics. It is not unlikely that alternative and more efficient procedures can be proposed in the future for selecting and calibrating the priority industries.
Following the heuristics of index (6), consider the industries priority scale. If nonpriority industries have a coefficient equalled 1, then priority ones receive a coefficient that is noticeably larger than 1. It is noteworthy that in our construct the agriculture industry has a multiplying coefficient equalled 4.5, production of means of labour – 3.5, mineral extraction – 2.5, and the pharmaceuticals industry – 1.5. Such a scale has its drawbacks, but it is fully consistent with an understandable survival model: people must have food and medicines, and production must possess raw materials and processing facilities. Further in the article, two scenarios for assessing the antifragility of the economy will be tested: extended (for all the four priority industries) and truncated (only for three industries, excluding pharmaceuticals).
To perceive the possibilities of improving the economic resilience, it is expedient to introduce the concept of a country’s tactical or local antifragility reserve. To determine this value, it is sufficient to calculate the maximum values of the priority industries’ shares on the time interval (τ; τ + T) and substitute them into expression (6):
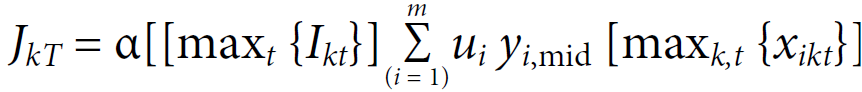 (8)
(8)
The value (8) characterises the antifragility level that the economy is really capable of, based on the available retrospective of data over a time interval of T years. We emphasise that this is not a speculative (theoretical) calculated value, but a real assessment of the economy’s capabilities, since it had previously had the appropriate parameters and, therefore, nothing prevents it from attaining them again. Then, the local antifragility reserve of the national economy will be determined by the value ΔJ:
 (9)
(9)
Based on the logic adopted, reserve (9), if necessary, can be activated in the short term, i.e., within 2–3 years. The global antifragility reserve of the national economy is represented by the maximum value of index (6) equalled 10. It is possible to reach this value, since the parameters corresponding to it were once achieved by some countries in certain periods of time. However, it is only hypothetically achievable and exclusively in the long run – within 10–15 years. At the same time, the maximum allowable limit of the Jdan antifragility index can be introduced, which is obtained by substituting the minimum possible values of the industry shares into formula (6):
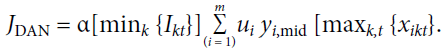 (10)
(10)
The country index nearing the bound (10) means that the national economy demonstrates the minimum ability to resist and stand up to international economic sanctions.
The proposed indicators allow getting a fairly complete insight into the mediumterm vulnerability of the national economy. Accordingly, the global minimum of the antifragility index is 0, while its global maximum is 10 (conditional points); for all countries, there is a local minimum in the form of the danger threshold JDAN, and for each country its local maximum JkT can be measured, which allows calculating its reserve ΔJ in strengthening the resilience of the economy. All the four values are constants over the time interval considered in the study, which makes them quite suitable for analysing the development of the processes under discussion.
Choosing a priority scale for the industries and invariance testing
Address the issue of choosing a priority scale for the industries. As indicated above, in all the calculations a heuristic scale with a one–point interval (step) was used, i.e., 1.5; 2.5; 3.5; and 4.5. It is legitimate to question the subjectivity of this scale. To that end, we will conduct computational experiments for several scenarios. The above variant serves as the baseline Scenario I, and three more additional scenarios – with a step of 0.5, 1.5, and 2.0 points – are used (Table 1).
Calculations show a rather high invariance of the antifragility index with respect to the priority scale. Even the transition to the most convex scale in Scenario IV does not lead to any fundamental changes. In fact, all index estimates are adjusted at the first decimal place. At that, if the range between the flattest (Scenario II) and the most convex (Scenario IV) scales produces a variation of 0.17 points for Russia, then for the USA it is only equal to 0.06 points. This fact unequivocally shows that the estimates computed in the baseline scenario make it possible to obtain a completely unambiguous and objective picture of the phenomenon under study.
Table 1. Results of experiments with weight coefficients. 2020
|
Indicators |
Scenarios |
|||
|
I |
II |
III |
IV |
|
|
Multiplying industry coefficient (ui) |
||||
|
Industries: |
|
|
|
|
|
agriculture |
4.5 |
3.0 |
6.0 |
7.5 |
|
mineral extraction |
3.5 |
2.5 |
4.5 |
5.5 |
|
mechanical engineering |
2.5 |
2.0 |
3.0 |
3.5 |
|
pharmaceuticals |
1.5 |
1.5 |
1.5 |
1.5 |
|
Antifragility index (Jk) |
||||
|
Countries: |
|
|
|
|
|
Russia |
2.64 |
2.47 |
2.74 |
2.81 |
|
USA |
1.64 |
1.64 |
1.65 |
1.65 |
|
Germany |
1.63 |
1.69 |
1.59 |
1.57 |
The established property of the antifragility index’s invariance with respect to the industries priority scale allows one to treat applied calculations with a sufficient degree of confidence. Apparently, for this scale, it is only the hierarchy of industries that matters – which of them is the most critical, and which is less significant; the very slope of the priority industries’ vector is of minor importance.
The second test, which is necessary to analyse the reliability of the antifragility index, is aimed at examining the invariance of the results depending on the transition to a more aggregated or, conversely, detailed set of industries. To that end, there were made calculations for three and four priority industries. At that, the sample for four industries (Scenario I) consisted of eight countries of the world, and the sample for three industries (Scenario II) included ten countries; in both cases, the basis vector of priority coefficients was used.
The calculations produced quite predictable results: in Scenario II, which is a more aggregated case, the antifragility index typically takes on large values. For example, in 2019, according to Scenario I, the antifragility index for Russia was 2.31, the USA – 1.27, and Canada – 1.93, while in Scenario II its values were 2.78, 1.12, and 2.22, respectively. Switzerland is the only country, for which the index shifts were found to be significant: the specified index in 2019 was 2.61 and 1.09 in Scenarios I and II, respectively. This fact is explained by the country’s special place in the global pharmaceutical market, which contributes to its significant strengthening under Scenario I.
When it comes to the qualitative aspects of the processes’ dynamics, the results for the two scenarios are absolutely identical. For instance, in Scenarios I and II, the trend in the antifragility index for Russia is upward, while for the other countries it is downward. In Scenario II, two more countries – South Korea and Japan – join the group of seven nations with a negative trend – Canada, Brazil, Germany, the UK, the USA, France, and Switzerland. Thus, the qualitative picture in both versions of the calculations appears to be the same. The equivalent result is typical of the structural relationship between the countries. Specifically, in both scenarios, Canada was the leader at the start, in 2003, while Russia was the leader at the finish line, in 2020. Brazil, the United Kingdom, and France were among the outsiders both at the start and at the finish. Accordingly, at the qualitative level, both calculation methods deliver consistent results, which indicates the objectivity of the approach underlying them.
It should be noted that the four–industry method is the best option, not only because of its greater information content, but also due to added flexibility and yet stability of the desired index’s values. This method will receive preference in further analysis of the real state of affairs.
Initial data and calculation results
It is worth emphasising that our first and foremost purpose is to test the developed antifragility index of the national economy and demonstrate its efficiency. An indepth analysis of the global economic system for all countries is beyond the scope of the original goals, so the calculations carried out are more of an illustrative, rather than purely evaluative nature.
As initial data, we used indicators of gross value added by economic industries [6] retrieved from the official websites of the statistical bodies of the analysed countries (Russia, Switzerland, Canada, the USA, Germany, Brazil, France, the United Kingdom, South Korea, and Japan), as well as their GDP per capita (PPP) based on the World Bank data. Calculations for 8 countries for 2003–2020 demonstrate quite peculiar results (Table 2).
Table 2. Antifragility index values for some countries
|
Countries |
Antifragility index (Jk) |
Trend, 2003–2020 |
Local maximum |
|
|
2003 |
2020 |
|||
|
Russia |
1.07 |
1.82 |
↑ |
2.98 |
|
Switzerland |
2.07 |
1.76 |
↓ |
3.28 |
|
Canada |
2.48 |
1.73* |
↓ |
3.59 |
|
USA |
1.30 |
0.89 |
↓ |
2.22 |
|
Germany |
1.24 |
1.20 |
↓ |
2.01 |
|
Brazil |
0.92 |
0.73 |
↓ |
1.42 |
|
France |
0.89 |
0.61 |
↓ |
1.34 |
|
United Kingdom |
1.10 |
0.51 |
↓ |
1.48 |
Note: (*) is own estimate.
Take a closer look at some of the obtained results (Figure). First, with the exception of Russia, there is a clear downward trend in the antifragility index of the countries under consideration, and, consequently, their ability to withstand external challenges and threats like IESs. In the past decades of the 21st century, the world’s advanced states openly neglected the issues of economic security, while paying close attention mainly to the effective integration into the system of the international division of labour. Such a short–sighted policy caused a significant decrease in the functionality of these countries’ economies in vital areas. Apparently, such synchronicity in the dynamics of the world economic development was the result of some kind of ideological cliche about the priority that should be given to ‘smart’ industries with the most modern technological achievements and state–of–the–art products. Traditional industries – agriculture, mineral extraction, production of means of labour, and pharmaceuticals – were categorised as unpromising, and developing countries were given the prerogative to supply goods produced by these industries.
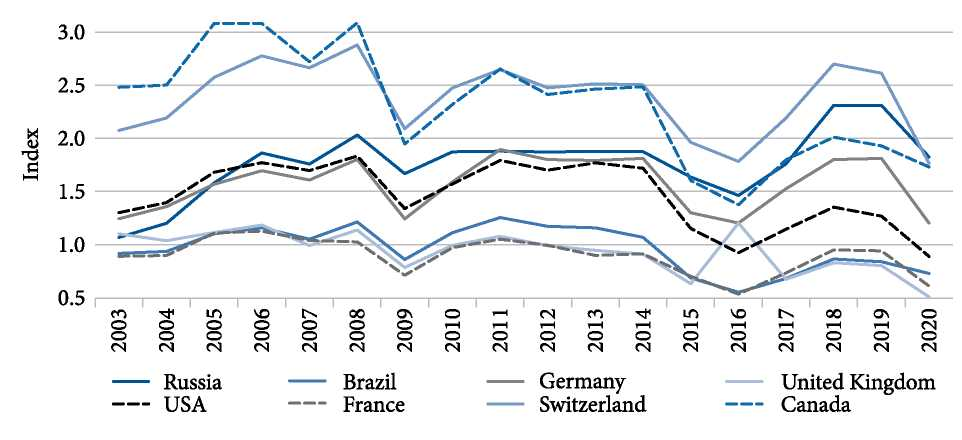
Dynamics of the antifragility index by country, 2003–2020
Second, the world geopolitical space is characterised by extreme heterogeneity of countries in terms of the level of the national economy resilience. The local danger threshold JDAN is 0.10, and the United Kingdom has already approached it, which indicates its very high vulnerability to any negative external influences. For comparison, the UK antifragility index in 2020 was 4 times lower than that of Switzerland, and 5 times lower than of Canada in 2003. At the same time, the British economy itself has become 2.2 times more fragile over 18 years, which illustrates a system error in the economic policy followed by the country’s leadership. This assumption is supported by the fact that the actual UK antifragility index in 2020 was 3 times lower than its local maximum, while in Brazil it is only 2 times lower against the background of its more modest upper limit. In other words, the UK is capable of but not intending to use its potential to enhance the resilience and independence of its economy. A similar situation is typical of Canada, which, as the absolute champion in the number of opportunities for ensuring economic sovereignty, uses only 48 % of the reserves available. The current state of the UK is 7 times inferior to the level that Canada is able to provide. These figures show how different the survival rate of peoples in different states is.
Third, the antifragility index makes it possible to quite successfully trace the political cycles and the nature of policies pursued by various national governments in certain time periods. For example, as clearly seen from Figure, the US antifragility index under Republican George W. Bush increased; however, it has been decreasing since 2009, when Democrat Barack Obama took office. During the first term of Obama’s administration, the index’s dynamics was unstable, but in the second term it demonstrated a consistent negative trend; by the last year of his administration, the Democratic president retained only half of Bush Jr.’s legacy. The rise to power of Republican Donald Trump in 2017 contributed to another upward reversal of the antifragility index, but the situation worsened again following the outbreak of the COVID–19 pandemic, which resulted in the formation of the ‘Trump hump’. There is every reason to believe that the rule of Democrat Joseph Biden will be marked by a noticeable drop in the ability of the American economy to resist negative phenomena.
In 2003–2006, the period of Liberal Prime Minister Paul Martin’s administration, Canada was experiencing a growth in its antifragility index. Thereafter, during the rule of the leader of the conservative party Stephen Harper until 2015, the index fell sharply with periodic attempts to recover, and with the advent of the liberal Justin Trudeau, it started slowly increasing again. In Russia, there are no cycles of the ruling party, but event–driven political patterns are easily detectable. During the first 8 years of Vladimir Putin’s rule, there was a steady increase in the antifragility index; between 2008 and 2012, when Dmitry Medvedev became the president of the country, the index fell slightly and stabilised; after the inclusion of Crimea into the Russian Federation and the subsequent IESs, the index decreased markedly again in 2016; after that, there was a period of systemic growth, which was later interrupted by the coronavirus pandemic. Thus, it can be reasonably argued that the dynamics of the national economy’s antifragility is directly associated with government policy.
Fourth, the country trajectories of the antifragility index make it possible to identify the geopolitical polarisation of the world and the civilisational confrontation of its main participants. For example, as already mentioned, the trend in the index was negative in 7 out of 8 countries, and for only one, namely, Russia, it was positive. Thus, the United States, as the leading power of today’s world, set the development model for other Western countries, which was successfully followed by them. In the light of the civilisational challenges levelled at it, Russia is forced to switch to the regime of a besieged fortress, which implies improving the antifragility of its economy. It can be assumed that Iran and North Korea are pursuing a similar strategy, but this hypothesis needs to be empirically confirmed.
Fifth, the dynamics of the antifragility index is characterised by special synchronisation points for many countries, which mark some kind of global economic collision. Specifically, in 2009 and 2016, all countries from the sample went through a synchronous drop in the antifragility index (see Figure). The mortgage crisis of 2008, with a year’s delay, led to the weakening of the foundations of all national economies, which seems to be a quite natural outcome. As for 2016, it was marked by numerous far–reaching shock events, such as Brexit (in the referendum on the UK’s membership in the EU, the majority of British people voted to leave the Union); the lifting of most sanctions against Iran and allowing it to supply oil to the global market; OPEC agreement to cut oil output; growing investments of many states in environmentally friendly energy sources [7]. Interestingly enough that Brexit exerted an asymmetrical effect on the British economy itself, which in 2016 slightly strengthened its life–critical industries. Hence, the antifragility index fits well into the general trends of the global economy and can serve as an additional indicator of ongoing processes.
Results discussion
Above we have analysed some factual results of testing the antifragility index. However, all of them need a meaningful discussion in terms of the adequacy of the approach used. In this regard, let us consider several intertwined aspects.
The first aspect concerns how legitimate it is to deal with the selected four industries as priority ones in terms of the national economy’s antifragility. To support our view, it is worth emphasising that we followed the tradition of Thomas Malthus, who pointed out three possible negative consequences of population growth, namely, famine, epidemics, and wars [Malthus, Peccei, 2021]. These fears are universal and projected onto countries facing IESs. War is not purely an internal affair of one particular country, while famine and epidemics are under the control of national governments. That is why, in order to eliminate famine and epidemics, it is of crucial importance to maintain agriculture and the pharmaceuticals industry in a viable state, which are reinforced by mineral extraction and the production of means of labour. Thus, the four industries represent the foundation of the national economy and ensure the survival of people; they also underlie the rest of the industrial superstructure aimed at creating additional life benefits.
The second aspect brings to the fore the discussion about the global priority of agriculture, which has long ceased to be a criterion for the success of the national economy.
It suffices to conduct a thought experiment with China, which, having a very high export complexity index, will be unable to find a market for its manufactured goods in the event of a break in external relationships, and thereby will lose the resources for purchasing the necessary food products. Here, we are talking about a technologically advanced power that may suddenly find itself on the verge of extinction. The strategic importance of agriculture has already been de facto recognised by the White House and the US Congress through the adoption in 2022 of a five–year plan for ‘climate interventions’ in order to create climate and solar radiation management technologies.
These plans, fairly controversial from the scientific and political perspectives, are largely provoked by the struggle to curb Russia’s dominance in agriculture. Experts acknowledge that agriculture is the most vulnerable sector of the American economy, especially in the face of climate change: due to heat, drought and soil degradation, the country’s arable land is shrinking every year; as forecasted, by 2040, yields in traditional agricultural states could fall by 90 %, and the grain–growing region will move to the Canadian border. At the same time, Russia, on the contrary, is benefiting from global warming: it is estimated that the area of productive farming in Siberia will double by 2080, whereupon the country will become the world’s largest producer of wheat with a market share of 20 % [8] Consequently, there is every reason to believe that under the new conditions agriculture is regaining the role of a strategically important industry.
The third aspect requires clarification of the connection between the antifragility index dynamics and the current stage of geopolitical inversion associated with the world centre of capital up to now represented by the United States and currently being replaced with a new, yet unknown leader [Balatsky, 2014]. It is easy to see that these processes are indeed connected. The fact is that the four priority industries under consideration lay the foundation of any economy, in which high–tech sectors and various non–productive segments are rooted in. However, while developing, the industrial superstructure is getting more complicated and increasing in scale relative to the economic foundation, which leads to global structural imbalances in the country’s economy. If the development is inertial, as it typically is, then sooner or later the superstructure industries saturate the relevant markets and lose their initial functionality. This process is completely natural and inherent in literally all branches of the economy and knowledge. When this happens, there emerges a global structural imbalance in the economy: the weakened foundation composed of the priority industries cannot withstand inefficient and hypertrophied industrial adjustment. At some point, this conflict will spark off a crisis and restructuring of the economy towards another strengthening of the foundation and renewal of the industrial superstructure. It is this fact that explains the cyclic movement of the world centre of capital across the planet. Thus, the obtained result sheds extra light on the driving forces and mechanism of geopolitical inversion.
Here, it is worth noting that Arrighi dealt with two stages in the formation of the world centre of capital, these are territorialism and capitalism. The real sector of the economy, i.e., industry, trade, construction, etc., develops at the stage of territorialism, which can also be called the phase of material expansion; at the stage of capitalisation, or financial expansion, the intangible sphere starts dominating, i.e., banks, insurance, investment, audit and analytical companies, the entertainment industry, etc. [Arrighi, 2006, p. 134]. Later, it was hypothesised that at the stage of territorial expansion, the rate of return of the manufacturing industry is generally higher than that of the financial sector, while at the stage of capitalisation the situation is exactly the opposite. Accordingly, each sector of the economy has its own development cycle in antiphase with another sector [Balatsky, 2018].
Additionally, at the second stage of the centre of capital formation, not only the efficiency and profitability of two economic segments are reshuffled, but also their scale characteristics are switched – the contribution to the total output of agriculture, pharmaceuticals, production of means of labour and mineral extraction decreases compared to non–productive activities. Today, we are witnessing an infrastructure crisis in the United States, where 2023 was marked by a record number of man–made, transport–related and other kinds of disaster. In fact, the non–productive sector got out of touch with reality, which affected the priority industries of the economy. In this regard, it is worth emphasising once again: the global crisis is rooted in a mental miscalculation that the virtual sector of the economy is prioritised over the real one, which underlies actions of governments and economic agents. The excessive strengthening of the former amid ignoring the problems of the latter are the main reason behind capital inflows to countries with more correct and realistic mental attitudes.
Thus, the above heuristics taking the form of the economy’s antifragility index not only logically fits into the existing theoretical concepts, but also allows them to be significantly enriched and refined.
Recommendations and proposals
The performed calculations can be used to establish the goals and benchmarks when implementing structural policy in order to ensure the technological sovereignty of a country. Consider this issue using the evidence from Russia.
The first thesis, which stems from the findings, is that there is the need to continue the sovereignisation of the country’s economy. For example, in 2019, the antifragility index in Russia was 77.5 % of its maximum, and in 2020 it was only 61.1 %. This means that today the country has the opportunity to increase its economic stability by about a third, which is what needs to be done over the next 3–4 years. During the period of geopolitical confrontation, which, apparently, will drag on for 15–20 years, one should strive to ensure the antifragility index at the level of 90–95 % of its maximum possible value.
The second thesis is the requirement to eliminate weak links from the industrial core of the economy. Statistical evaluations show that such bottlenecks in Russia are mechanical engineering and pharmaceuticals, which should increase their outputs at an accelerated pace. According to the data for 2020, among all the countries in the sample, Russia appeared as an absolute outsider in these two industries, which is unacceptable in the context of geopolitical confrontation. In the short and medium term, it is expedient to strive for the share of mechanical engineering in Russia to increase from 0.5 % in 2020 to the level of Brazil equalling 1.2 %; in the long term, the German level of 3.0 % can be set as a target. Consequently, within 3–4 years, Russia needs to enhance the share of mechanical engineering 2.0–2.5 times, and within 10 years – 5–6 times. Speaking of pharmaceuticals, in the short and medium term it is necessary to move from 0.4 % in 2020 to the Brazilian level of 0.6 %; in the long term, the level of Switzerland equalling 4.8 % can be used as a target. Accordingly, within 3–4 years, the share of the pharmaceutical industry should be increased 1.5–1.7 times, and within 10 years – 10–12 times. These assessments make it possible to realise the scale of the structural manoeuvres that Russia needs. At that, progress along this path will also lead to an increase in the upper limit of Russia’s antifragility index, which will expand its stability potential and the zone for optimising the configuration of the four priority industries.
 (11)
(11)
where x(0) is the share of the priority industries at the initial moment of time; x* is the target share of the priority industries; Δx = x* – x(0) is a planned structural shift in the priority industries; λ is a projected growth rate of the national economy; λ* is the required growth rate of the priority industries’ output; T is a project period of structural shifts.
If we assume that the share of pharmaceuticals and mechanical engineering in Russia is currently at the level of 2020, the economy will be growing at a rate of 2 % in the next 4 years, the target for pharmaceuticals is the same as today’s US level of 1 %, and for mechanical engineering it is equal to the current Switzerland level at 1.5 %, then the output of these two industries in Russia should be growing at an average annual rate of 3.2 %. Such an outcome is by no means beyond the limits of the possible and can be achieved through the proper organisation of production and sales of products. Shorter timeframes and higher targets will require the priority industries to develop more dynamically and more resources to be mobilised.
Conclusion
In the current study, the proposed concept for assessing the antifragility of the national economy has been pilot tested on a rather small sample of countries. The results obtained hold out a hope that further application and refinement of the basic method will be useful not only for apprehending global economic processes, but also for projecting structural shifts in the economy. In this regard, we can think of the following avenues for our approach to develop.
First, the sample of countries and the retrospective period for applied calculations can be significantly expanded. This will allow compiling an international antifragility rating of national economies, which, in turn, can help to clarify the disposition that is taking shape in the global geopolitical space. An extensive array of data will presumably reveal those patterns of the world economic system transformation that are not detectable in small samples. Among the similar initiatives is the export complexity index, which has become today a standard analytical tool with total spatio–temporal tabulation carried out by various research centres (for example, the Harvard Growth Lab or the Center for Collective Learning at the University of Toulouse and the Corvinus University [9]) on a regular basis.
Second, the antifragility index of the economy can and should become one of the indicators of the national security system, and above all its economic facets. The annual testing of this indicator should be a common procedure in evaluating the economic sovereignty of a country. Moreover, it can also be useful in terms of the current macroeconomic policy, which should not provoke regimes to weaken the priority industries of the economy.
Third, the antifragility index can be improved by expanding the number of the priority industries included in it. It is quite possible that adding one or two positions will significantly increase the index’s indicative ability. Computational experiments performed in this direction can produce unexpected results.
Despite the heuristic nature of the antifragility index, we can state that, owing to its quantitative characteristics and meaningful interpretations, it is viable and can be further improved. This new tool is gaining in relevance due to the transition from the period of globalisation to the stage of deglobalisation, where the technological competition of complex industries in the growth phase is replaced by the competition of resource provision with comparatively simple products in the phase of the relative stagnation of national economies.
At such times, traditional analytical tools and indicators lose their effectiveness and informational value, while indicators of the economic antifragility become of paramount importance. Apparently, these new measures are not universal characteristics of the social system as well and will be relevant mainly during the transitional period of international confrontation. However, this period can drag on for 20–30 years, which is the reason for the current interest in them and the prospects for their improvement.
References
Arrighi G. (2006). The long twentieth century: Money, power and the origins of our times. Moscow: Territoriya budushchego Publ. 472 p. (In Russ.)
Balatsky E. V. (2016). “Technical” method for estimating the probability of sovereign defaults. Mir novoy ekonomiki = The World of New Economy, vol. 10, no. 3, pp. 48–61. (In Russ.)
Balatsky E. V. (2018). The Arrighi’s concept of capital accumulation cycles and its applications. Terra Economicus, vol. 16, no. 1, pp. 37–55. DOI: 10.23683/2073–6606–2018–16–1–37–55. (In Russ.)
Voronina V. N. (2021). Entertainment industry in the global economy. Rossiyskiy vneshneeko–nomicheskiy vestnik = Russian Foreign Economic Journal, no. 10, pp. 22–37. DOI: 10.24412/20728042–2021–10–22–37. (In Russ.)
Dalio R. (2023). Principles for dealing with the changing world order: Why nations succeed and fail. Moscow: Mann, Ivanov i Ferber Publ. 528 p. (In Russ.)
Malakhov V.A., Yurevich M.A., Aushkap D.S. (2018). Iran: The positive experience of S&T development. Mirovaya ekonomika i mezhdunarodnye otnosheniya = World Economy and International Relations, vol. 62, no. 11, pp. 116–124. DOI: 10.20542/0131–2227–2018–62–11–116–124. (In Russ.)
Malthus T., Peccei A. (2021). “Too crowded”. On benefits of wars and epidemics. Moscow: Rodina Publ. 228 p. (In Russ.)
Taleb N. N. (2014). Antifragile: Things that gain from disorder. Moscow: KoLibri Publ., Azbuka– Attikus Publ. 768 p. (In Russ.)
Shumov V.V. (2015). National security and geopotential of the State: mathematical modeling and forecasting. Kompyuternye issledovaniya i modelirovanie = Computer Research and Modeling, vol. 7, no. 4, pp. 951–969. (In Russ.)
Shumov V.V. (2016). State and public security: Modelling and Forecasting. Moscow: Lenand Publ. 144 p. (In Russ.)
Balatsky E.V. (2014). Prerequisites for global geopolitical inversion. Economic and Social Changes: Facts, Trends, Forecast, vol. 32, no. 2, pp. 28–42. DOI: 10.15838/esc/2014.2.32.4.
Bergsten C.F., Gill B., Lardy N.R., Mitchell D. (2006). China: The balance sheet. What the world needs to know about the emerging superpower. New York: Public Affairs. 206 p.
Briguglio L. (1995). Small island developing states and their economic vulnerabilities. World Development, vol. 23, no. 9, pp. 1615–1632. https://doi.org/10.1016/0305–750X(95)00065–K.
Briguglio L., Cordina G., Farrugia N., Vella S. (2009). Economic vulnerability and resilience: Concepts and measurements. Oxford Development Studies, vol. 37, issue 3, pp. 229–247. DOI: 10.1080/13600810903089893.
Briguglio L., Galea W. (2003). Updating the economic vulnerability index. Malta: Islands and Small States Institute of University of Malta. 15 p.
Capello R., Caragliu A., Fratesi U. (2015). Spatial heterogeneity in the costs of the economic crisis in Europe: Are cities sources of regional resilience? Journal of Economic Geography, vol. 15, issue 5, pp. 951–972. DOI: 10.1093/jeg/lbu053.
Chang S.E., Rose A.Z. (2012). Towards a theory of economic recovery from disasters. International Journal of Mass Emergencies & Disasters, vol. 30, no. 2, pp. 171–181. DOI: 10.1177/028072701203000202.
Christopherson S., Michie J., Tyler P. (2010). Regional resilience: Theoretical and empirical perspectives. Cambridge Journal of Regions, Economy and Society, vol. 3, issue 1, pp. 3–10. DOI: 10.1093/ cjres/rsq004.
Di Caro P. (2015). Testing and explaining economic resilience with an application to Italian regions. Regional Science, vol. 96, issue 1, pp. 93–113. DOI: 10.1111/pirs.12168.
Duan W., Madasi J.D., Khurshid A., Ma D. (2022). Industrial structure conditions economic resilience. Technological Forecasting and Social Change, vol. 183, 121944. DOI: 10.1016/j.tech–fore.2022.121944.
Giannakis E., Bruggeman A. (2017). Determinants of regional resilience to economic crisis: A European perspective. European Planning Studies, vol. 25, issue 8, pp. 1394–1415. DOI: 10.1080/09654313.2017.1319464.
Hausmann R., Hwang J., Rodrik D. (2007). What you export matters. Journal of Economic Growth, vol. 12, no. 1, pp. 1–25. DOI: 10.1007/s10887–006–9009–4.
Hausmann R., Rodrik D. (2003). Economic development as self–discovery. Journal of Development Economics, vol. 72, no. 2, pp. 603–633. DOI: 10.1016/ S0304–3878(03)00124–X.
Kliesen K. L. (1994). The economics of natural disasters. Regional Economist (Federal Reserve Bank of St Louis), issue April, pp. 5–9.
Navarro–Espigares J. L., Martin–Segura J. A. (2012). The role of the service sector in regional economic resilience. The resilience of the global service economy. The Service Industrial Journal, vol. 32, issue 4, pp. 571–590. DOI: 10.1080/02642069.2011.596535.
Nistotskaya M., Charron N., Lapuente V. (2015). The wealth of regions: Quality of government and SMEs in 172 European regions. Environment and Planning C: Policy and Space, vol. 33, issue 5, pp. 1125–1155. DOI: 10.1177/0263774X15610058.
Oprea F., Onofrei M., Lupu D., Vintila G., Paraschiv G. (2020). The determinants of economic resilience. The case of Eastern European regions. Sustainability, vol. 12, issue 10, 4228. DOI:10.3390/ su12104228.
Peduzzi P., Dao H., Herold C., Mouton F. (2009). Assessing global exposure and vulnerability towards natural hazards: The Disaster Risk Index. Natural Hazards and Earth System Sciences, vol. 9, issue 4, pp. 1149–1159. DOI: 10.5194/nhess–9–1149–2009.
Rodrik D. (2006). What’s so special about China’s exports? China and World Economy, vol. 14, no. 5, pp. 1–19. DOI: 10.2139/ssrn.832651.
Simmie J., Martin R. (2010). The economic resilience of regions: Towards an evolutionary approach. Cambridge Journal of Regions, Economy and Society, vol. 3, issue 1, pp. 27–43. DOI: 10.1093/ cjres/rsp029.
Vega S. H., Elhorst P. (2014). Modelling regional labour market dynamics in space and time. Regional Science, vol. 93, issue 4, pp. 819–841. DOI: 10.1111/pirs.12018.
Xu M., Radhakrishnan S., Kamarthi S., Jin X. (2019). Resiliency of mutualistic supplier–manufacturer networks. Scientific Reports, vol. 9, 13559. DOI: 10.1038/s41598–019–49932–1.
[1] Badenhausen К. (2018). How Floyd Mayweather made a record $275 million for one night of work. Forbes. Jun 5. https://www.forbes.ru/biznes/362933-udarnyy-trud-kak-floyd-meyvezer-zarabotal-rekordnye-275-mln-za-odin-vecher. (in Russ.)
[2] Civision PR Newswire. (2018). Bristlecone launches the world’s first Antifragility Index. https://www.prnews-wire.com/news-releases/bristlecone-launches-the-worlds-first-antifragility-index-668426273.html.
[3] Atlas of Economic Complexity. Country & Product Complexity Rankings. https://atlas.cid.harvard.edu/rank-ings; https://oec.world/en.
[4] OKVED stands for the Russian Classification of Economic Activities.
[5] Portyakova N. (2021). Risk and rice: Is it really a food crisis in North Korea? Izvestiya Newspaper. June 22. https:// iz.ru/1181673/nataliia-portiakova/na-strakh-i-ris-na-samom-li-dele-v-kndr-prodovolstvennyi-krizis. (In Russ.)
[6] Economic industries were considered in accordance with the Russian Classification of Economic Activities (OKVED 2) and the International Standard Industrial Classification of All Economic Activities (Rev. 4).
[7] Chemodanova К. (2016). Escape from Europe: The key events of 2016 in the global economy. https://russian.rt.com/business/article/343690-mirovaya-ekonomika-itogi-2016. (In Russ.)
[8] RIA News Agency. (2023). The final argument. America is preparing to use climate-change weapons. https://ria.ru/20230312/klimat-1856861090.html. (In Russ.)
[9] OEC. The best place to explore trade data. https://oec.world/en; The Center for Collective Learning. https://centerforcollectivelearning.org/.
Official link to the paper:
Balatsky E.V., Ekimova N.A. Antifragility of the national economy: A heuristic assessment // «Journal of New Economy», 2023. Vol. 24, no. 2, pp. 28–49.