
Economic reforms of the past few years have substantially changed the sectoral production structure in Russia. To understand what is going on, we must assess, first, the shifts in the place and profitability of the sectors of the national economy, second, their contribution to the country’s GDP, and, third, the range’ within which their profitability varies.
General characteristic of the structure of the GDP
Let us first take a look at the most important structural changes. Table 1, compiled on the basis of production accounts that constitute the system of national accounts [1], shows that the share of services steadily rose, from one–third to one–half between 1989 and 1995. The growth was, however, very uneven. In 1992, this indicator was lower than in 1991, after which a fantastic leap, almost 14%, occurred. In 1995, the share of services in aggregate value added declined again after reaching a peak, 51%, in the preceding period.
Table 1. Structure of the production of gross value added, percent
|
Share of services |
1989 |
1990 |
1991 |
1992 |
1993 |
1994 |
1995 |
|
Share of services in aggregate value added |
32.4 |
35.0 |
37.8 |
35.3 |
49.1 |
51.0 |
49.5 |
Dynamic instability also marks the trend towards stronger market orientation of services. In 1990–1991, the share of market services rose very sharply, by 9%. This anomalous effect can be explained only by the purposeful and excessive acceleration of economic reforms and overemphasis on their market slant. In 1993, “marketization” of this sphere reached its peak, after which there began structural fluctuations clearly intended to alleviate market pressure. This confirms once again that there is no effective control of the processes changing the structure of the production of services, and that the scope of the market sector is unjustifiably inflated. In view of this, there is need for managerial decisions that would restrain spontaneous trends. Simultaneously, to raise the efficiency of the Russian economy, a sensible structure of services should be determined, with the minimum scope of the market sector as the point of departure.Although an increase in the share of the services was natural and, in fact, unavoidable, its high rate made it difficult to achieve a balance in the work of all national economic links. For the majority of the transition period, restructuring of the economic system was spontaneous as it tried to adjust to the unsatisfied demand for services. The principle of sustained development, a priority in most macroeconomic doctrines, was disrupted. In this context, the years 1992 and 1993 can be regarded as a period of structural breakdown rather than of structural reform. Two factors contributed to the unprecedented rise in the share of the services: disruption of production, which enabled services to make a spurt, and more comprehensive (since 1993) statistical coverage: thanks to the introduction of penalties for the legal entities who failed to submit information within the prescribed time–limits, economic agents that used to be invisible began to fall within the field of vision of statistical bodies. However, these two factors cannot fully explain the structural changes that have taken place. The latter are usually accompanied by social tensions, as we all know only too well. On the whole, the trend towards the domination of services had a negative dynamic pattern; this process should be controlled so as to make the structural shifts smoother.
Methodology of structural analysis of sectoral shifts
Let us try to identify the structural shifts in the production of the GDP by estimating the share of each sector in aggregate value added. But first, I will give a few methodological comments.
First, the most reliable statistics can be found in the annual production accounts by sectors [1]; analysis should rest on this information.
Second, the estimates sought do not follow automatically, because the basis for comparison that is used is not the GDP (although this would be ideal) but the GDP minus the subsidies for goods and the cost of the services of financial go–between, plus the tax on goods. This technique must be used because all structural coefficients have to be rated. There are two rules: first, all sectoral shares must be positive and add up to 100% (if the percentage is calculated). Since the taxes and the subsidies constitute separate line items in the national accounts and the cost of the go–between services is a negative value, it would be correct to first deduct these line items from the GDP.
This technique is not faultless. Specifically, since the go–between services, taxes, and subsidies are “spread over” the sectors, distortions of the final data are possible, although they are usually insignificant and in principle cannot affect the final conclusions.
The main purpose of our analysis is to reveal the turning points in the dynamic of the sectoral share coefficients. The presence of such points is a distinctive characteristic of transition economies; to reveal them is one of the main tasks of macroeconomic analysis. Moreover, transition economies are marked by strong economic fluctuations, and the effect of starting conditions plays a determinative role.
In view of this, the methodology of the study rests on the analysis of the geometric form of the temporal curves indicating the share of the sectors in gross value added. Superimposition of the branch trajectories makes it possible to identify the main stages in Russian economic restructuring.
Rules of GDP restructuring by sectors
Calculations on the basis of the schemes described above prompt some interesting conclusions about the way market processes are unfolding in Russia. Not all the sectors of material production retreated to the same extent under pressure from services. Contrary to apprehensions, industry resisted the most. Moreover, the preperestroika “industry syndrome” was not immediately replaced by a trend toward the rise of services. Up to 1992, industry continued to grow through the force of inertia, only to crash in 1993 (a drop of 12.5 points). The turning point in Russia’s economic development strategy can be fixed exactly: 1993. In that year, priority development of the infrastructure became final. However, since the dynamic of industry’s share in gross value added was humplike, over the six years of reforms, this indicator fell only 5%. In my view, this is very little, especially considering the absolute value of this indicator.
Construction surrendered slowly but surely. Agriculture put up quite a fight for its place in the GDP, but this sector more or less stabilized only by 1995. The only exception in all material production sectors was forestry, which managed to hold on, although by the mid–1990s its share remained practically invisible in macroeconomic terms. A directly opposite trend was typical of the information and computer services, whose share was almost halved. At the time of rapid advancement of computer technologies, one of the high–tech industries shrank to laughable dimensions in Russia.
In services, sectoral inequality was even greater than in material production. This sphere can be divided into two groups: services whose share decreased, and services whose share increased. The latter category includes transport; communications; trade and public catering; finances, credit, insurance, and pensions; general commerce; real estate; geology, land surveying, and weather forecasting; health care, physical training, and social security; servicing of agriculture; road construction; public associations; defense; and management. This list reflects the priorities operating in the first half of the 1990s.
Although many sectors increased their share in the GDP, the real record setter was trade and public catering: in 1989–1995, their share rose by almost five times. The 10% leap they made in 1992–1993 is obviously connected with the sharp drop of the share of industry. It is probable that in 1993, the “substitution effect” in the structure of economic demand, which was in abeyance for a long time, finally made itself felt. This fact confirms the conclusion that 1993 was the turning point for the Russian economy: the industrial society was finally replaced by a postindustrial one, and an information–service society was built. The vanguard was trade, which is practically always the “trail–blazer” at times of radical economic change. The dynamics of its share in the past three years indicates that the economy’s demand for the services offered by trade is satisfied; further changes are becoming more predictable, lending themselves more easily to forecasting.
Table 2. Sectoral structure of the production of gross value added, percent
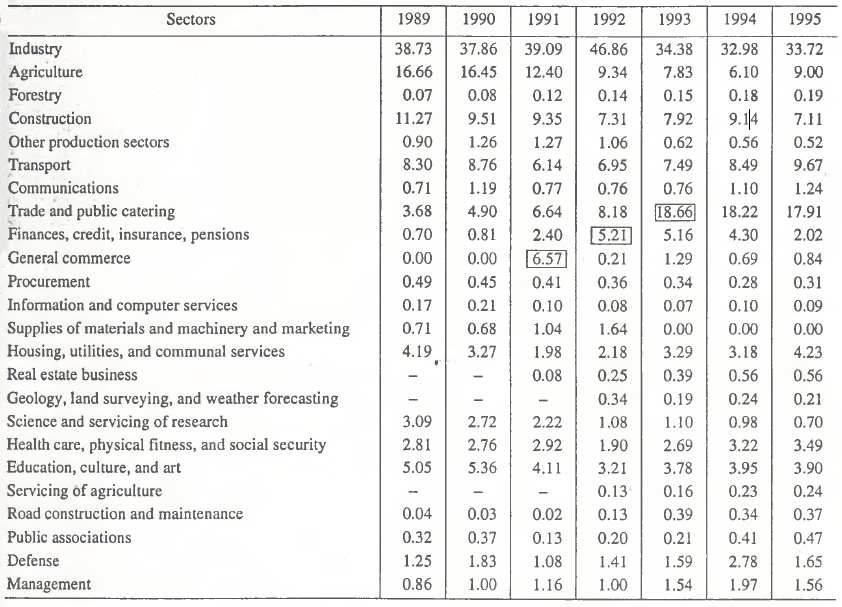
Irregularity of the dynamics of the production structure during the transition period was most obvious in two “ultra–market” spheres, under which the first economic shifts took place. The reference is, first, to finances, credit, insurance, and pensions and, second, to general commerce. The “transition wave” observed in the dynamics of almost all economic spheres is very easy to see here. A more detailed analysis reveals an interesting sequence in the spread of market impulses to the different elements of the macroeconomic system. The big boom of general commercial activity aimed at supporting the market in 1991 laid an organizational foundation for the transformation of the entire society. In my view, this is what enabled the financial sector represented by finance, credit, insurance, and pension institutions to accomplish economic expansion on the services market in 1992. The large–scale mobilization of money resources that followed gave a powerful impetus to the development of the trade network. Having reached the peak of its development, each of these sectors passed on the baton to the next leader and in the following years lagged noticeably behind the others. In other words, having performed the transformation function (spontaneously, since at that time no one recognized it as such), the sector in question gradually lost its frontline position. This obvious annual “diagonal” alternation of the three sectors reveals the extremely important and, most probably, universal rule of the transformation of a planned economy into a market economy.
The structural dynamic rules of the formation of the GDP are covered by various private economic trends. For example, analysis of the share of public associations reveals that its temporal trajectory is asymmetrical in relation to the main “transition wave” and that it had a global minimum in 1991. As this item of gross value added reflects the volume of “humanitarian capital,” which has been accumulated by society and is a by–product of the economic reproduction process, certain conclusions can be drawn.
As market relations were established in Russia, interest in public associations waned. Their share in the GDP began to decline because their maintenance was financially burdensome. This went on up to 1991, when the adverse effect of economic reforms upon the social sphere was at its strongest. Then, the climate warmed a little, interest in public associations revived, and this was reflected in the rise of their share. In 1995, this indicator exceeded its starting value of 1989, an encouraging trend.
The critical year for health care, physical training, and social security was 1992. The next year, the slump in this sector was reversed, and two years later its position became stronger than in 1989. The dynamic excesses here were a step behind those in the sphere of public associations. This is only natural, since the latter are the first to respond to the new social development imperatives and are ahead of the real sector of the economy (health care, physical training, and social security). This lag is practically ineradicable.
Throughout the transition period, a number of sectors performed the function of support for the emerging economic system. They are marked by a gradual increase of the share indicators, and, as the country moves toward the market economy and despite the general economic collapse of production, they demonstrated relatively higher viability. This reference is mainly to the “new” economic sectors, the ones that appeared as a result of market reforms: the servicing of agriculture, the road industry, the real estate business. The “traditional” branches–defense, management, transport, communications–performed the same functions, although their development was not so unidirectional.
Let us now take a look at the sectors that in the past few years have shown a decline. Take the procurement system. When economic growth begins, its share may rise insignificantly; as for the supplies of materials and machinery, this branch ceased to exist as an independent element of the economy and by 1993 disappeared as a contributor to the GDP.
There are two major sectors that help create human capital: education, culture, and art, and science and the servicing of scientific research. For the former (as for the social sphere generally), the hardest year was 1992. Then, the situation began to change for the better, and this branch is now developing at a rapid enough pace, although the initial level has not yet been reached.
In science, the situation is much worse: between 1989 and 1995, it moved from 8th to 14th place; its share fell by almost 4.5 times. But the most important thing is that over the six years of sectoral restructuring, the share of science has been declining quite inexorably. There is the impression that, absurd though this may sound, it is one of the most hopeless, moribund spheres. If the “research consumption” of the Russian GDP continues to fall or even stays at the 1995 level, Russia cannot be expected to become a competitive, full–bloodied world market agent. And, although the sectoral structure of gross value added has recently become much more normal and mature in market terms, this circumstance largely devalues these positive shifts.
The rate of structural shifts
Let us consider two aspects of Russian economic development during the transition period: the intensity of structural shifts and the degree of irregularity of the branch structure.
Structural activity coefficient к can be calculated from
 (1)
(1)
where уi,t is the share of industry i in gross value added at moment t [2]. Calculated as a percentage, the coefficient is presented in Table 3.
Table 3. Activity of the sectoral structure of the GDP
|
Indicators |
1989–1990 |
1990–1991 |
1991–1992 |
1992–1993 |
1993–1994 |
1994–1995 |
|
Structural activity coefficient |
3.7 |
11.9 |
14.9 |
15.8 |
5.4 |
6.3 |
|
GDP growth index, percent |
– |
95.0 |
85.5 |
91.3 |
87.3 |
95.8 |
|
Structural mobility coefficient |
– |
11.3 |
12.7 |
14.4 |
4.7 |
6.0 |
As L.A. Ledov [2] justly notes, most methods of measuring the rate of structural shifts ignore the scope of the processes under way. To overcome this fault, the traditional indicators should be rated. Different approaches are possible; I shall use the GDP growth index as the rating coefficient (strictly speaking, the gross value added growth index would be more appropriate). In this case, coefficient к is transformed into structural mobility coefficient g:
g=Lk (2)
where L is the GDP growth index for the same period as k.
Coefficient g is introduced because of the need to take into account the fact that structural shifts gain in intensity during economic collapse, when the structure itself shrinks. A comparison of the values of coefficient к during an economic upturn and during recession is unjustifiable and may easily mislead the analyst. The use of the structural mobility coefficient is effective when comparing the laws of structural development at different phases of the economic cycle. Russia has approached the threshold beyond which the slump may be replaced by growth: this is why coefficient g has been introduced. Retrospective calculations of the structural mobility coefficient as the percentage presented in Table 3 indicate that it changes synchronously with coefficient k, because both are applied to the period of economic recession.
The dynamics of the changes in structural shift activity also obey the main law of the transition period, movement along the “transition wave,” which reached its peak in 1992–1993. This confirms again the conclusion that radical transformations of the sectoral structure of Russian production began at that time. In conformity with the turning point identified, the transition period can be divided into two stages: rapid growth of structural perturbations and rapid slowing down. In the late 1980s, structural shifts were still slow, but rapidly accelerated in the first years of the next decade. In fact, we can establish the exact date of the outset of the transition period in Russia: 1990. This is when targeted and sustained structural shifts began. The figures presented in Table 3 lead one to conclude that in the next few years, structural reform will slowly die down, because in 1995 the Russian economy entered a period of relative stability.
And now a few words about how evenly (unevenly) the country’s GDP was formed in terms of the sectors contributing to it. To make a quantitative assessment, let us use the structural irregularity coefficient/, which is calculated from the formula:
(3)
where ymed = 1/n.
Correspondingly, correlation (3) can be presented as
.png)
(4)
In our case, n = 24; the digital values of coefficient f are presented in Table 4. Analysis shows that in the first few years of the transition period, the level of structural irregularity was not high and even tended to go down. At that time, the sectoral structure somewhat evened out and was likely to achieve some balance. However, since 1992, the system left a stationary trajectory; its structural inequality increased and continued to stay at a high level in the period that followed. This trend is connected with the trend in the change of the rate of structural shifts. It is likely that in the future, the GDP will be “distributed” more evenly among the sectors.
Table 4. Irregularity of structural development of the Russian economy
|
Indicators |
1989 |
1990 |
1991 |
1992 |
1993 |
1994 |
1995 |
|
Structural irregularity coefficient |
23.6 |
23.3 |
22.8 |
27.6 |
25.7 |
24.8 |
25.8 |
Dynamics of the sectors’ profitability
To analyze the “inner” state of individual economic sectors during the transition period, that is, their efficiency, let us use sector profitability ratio r„ which takes into account the given accounts of income–formation by sectors:
.png)
(5)
where Si is the ratio of net profit of industry i to gross output; λi – is the ratio of the subsidies to industry i to gross output. Quantitative assessments of profitability ratios for λ = 0 presented in Table 5 reveal interesting trends.
Table 5. Efficiency dynamics of economic branches, percent
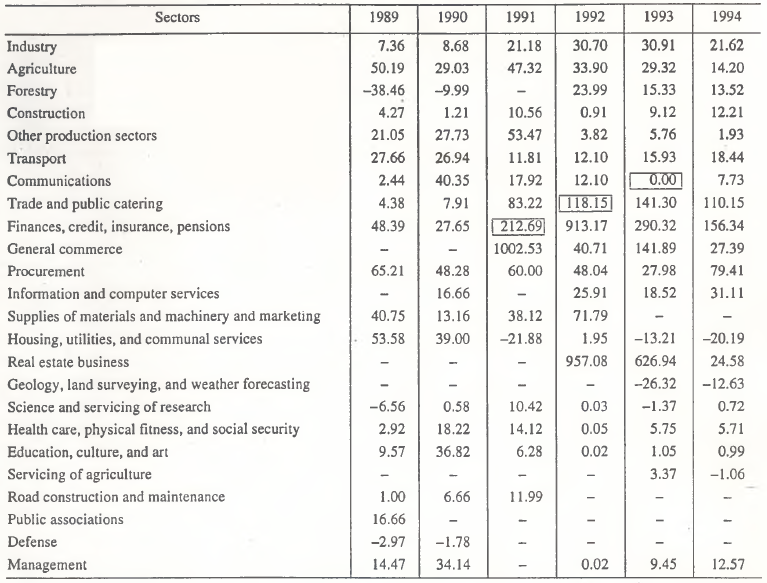
First, the profitability dynamics show “transition arches”; in other words, the economy’s efficiency characteristics also obey the general rule of the transition period.
Second, in time, the profitability of economic links declined. The profit–making boom of 1992–1993 was soon over, and in 1994, there began a period of wholesale stiff competition without superprofits. Two reasons for the huge leaps in the profitability of various sectors are usually quoted: the effect of starting conditions, when many industries in Russia were just coming into being and the demand for their products and services was practically unlimited, and galloping inflation, which caused inflationary superprofits to appear and thus inflated the final profitability ratios [3, 4]. In 1994, both these factors ceased to operate, and profitability in most sectors became more modest.
Third, the gap between the profitability of different sectors became narrower. This means that by 1994, conditions became more uniform and the rate of profit by sectors evened out. This conclusion is confirmed if we calculate the profitability disparity ratio by sectors, whose formula is analogous to (3).
If the statistics in Table 5 are compared to those obtained earlier, the profitability dynamics would reveal several curious points (in addition to minor hardto–explain fluctuations). The trend toward the decline of the share of industry does not look so indisputably negative. The highest profitability level was reached in 1993, when industry got rid of most of its “ballast.” The outsized low–profitability sector comprising mostly large enterprises was replaced by a more adjustable and viable formation consisting mainly of compact production units. The same happened in communications and construction, and, to a certain extent, in procurement.
The logic of the evolution of the three basic sectors, the foundation of all market reforms (trade and public catering; finances, credit, insurance, and pensions; and general commerce), is faultless. Their profitability trajectories have the same peaks as the curves of share indicators. Consequently, the “diagonal effect” can also be observed here: 1991 witnessed an unprecedented rise in the profitability of general commerce; 1992 was the best year for finances, credit, insurance, and pensions; 1993 was the year of the triumph of trade. In 1992, this process was joined (and bolstered) by yet another new sector, real estate business.
The situation was not bad in health care, physical training, and social security, where the pre–reform profitability ratios rose. 'Education, culture, and arts fared less well: in the past years, their “thrashings” in the market were largely futile. Science is really in dire straits. On one hand, it has ceased to be overtly loss–making and has become self–financing, but, on the other hand, this trend is extremely weak, and on the whole, this sphere is balancing on the brink of total bankruptcy. The crisis dealt the worst blow to housing, utilities, and the communal services business, which used to be highly profitable and is now the worst loss–maker.
By 1994, although working against great odds, the information and computer business reached a respectable profitability level, 31%. Good results are shown by forestry. It completely overhauled its operation, ceased to be an outsider, and is now relatively prosperous.
A truly amazing situation was formed in agriculture. In 1989, it used to hold third place as regards profitability, although its financial insolvency is known well enough. The subsidies that are pumped into it and ensure a high profitability level look odd, to put it mildly. Since its nourishment was totally artificial, agriculture has been retreating from its positions throughout the transition period.
I realize that this analysis can hardly cause euphoria. Nevertheless, positive aspects are also obvious. First, the sectoral structure of production has gradually acquired a normal market aspect, and this is paving the way for economic stability and implies not so much quantitative as qualitative shifts within the framework of the established structure. Second, a competitive economy has come into being; the opportunities for getting superprofits have been exhausted. In this environment, economic laws and effects can freely manifest themselves and are easier to predict.
The transition period in the Russian economy is coming to an end; many trends are becoming stable. In these conditions, there is a chance to make better–substantiated forecasts using traditional methods and models; this, in turn, facilitates drafting efficient macroeconomic regulation measures.
References
1. Rossiiskii statisticheskii ezhegodnik: Stat. sbornik (Russian Statistical Yearbook: Collection of Statistics), Moscow: Logos, 1996.
2. Dedov L.A., Strukturno-dinamicheskii analiz v ekonomike (Structural–Dynamic Analysis in Economics), Izhevsk: Izhevsk. Gos. Tekh. Univ., 1995.
3. Balatskii E.V., Inflationary Taxes and Economic Growth, Ekonomika i matematicheskie metody, 1997, vol. 33, issue 3.
4. Vodyanov A.A., Investitsionnye protsessy v ekonomike perekhodnogo perioda (metody issledovaniya i prognozirovaniya) (Investment Processes in a Transition Economy: Study and Forecasting Methods), Moscow: IMEI, 1995.
Official link to the article:
Balatskii E.V. Shifts in the Russian Economy’s Sectoral Structure// «Herald of the Russian Academy of Sciences», Vol.68, No.2, 1998, pp. 89–95.