INTRODUCTION
Throughout its history, humanity has sought to achieve economies of scale. Over the centuries and millennia, this fundamental pursuit has remained unchanged. Today, Russia, facing sanctions and a severe shortage of investment resources, must leverage its natural advantages, which enable significant economies of scale across various sectors. It has already been proven that in certain industries of the Russian economy, this effect is particularly pronounced and can drive substantial technological breakthroughs and intensive economic growth [1, 2]. This serves as a starting point for further theoretical exploration.
At the same time, while economies of scale are a powerful driver of technological progress, they are not sufficient on their own to make effective investment decisions. Even with a relatively high technological level of production and a substantial reserve in terms of economies of scale, these factors alone are not enough to definitively prioritize a particular production segment. Such production may still be highly expensive (capital–intensive) for various reasons, including climatic, geographical, and logistical factors. Therefore, when aiming to achieve economies of scale, it is essential to account for the costliness of the production process. This task is far from straightforward and requires a step–by–step quantitative analysis of all aspects of production and investment. Moreover, this complexity applies not only to the establishment of new production facilities within the country but also to the expansion of existing clusters. This sets the objective of the article: to elucidate the entire logical framework of investment decision–making – from evaluating the technological level of production achieved through economies of scale to assessing the capital intensity of specific territorial and sectoral production segments. The theoretical approach will be tested using data from two samples, each comprising seven of the most promising and developing regions in the agricultural sector.
If necessary, the proposed methodology can be applied to any sector of the economy.
PROBLEM STATEMENT AND LITERATURE REVIEW
In its canonical interpretation, economies of scale refer to a reduction in production costs as output increases [3]. Modern literature contains a significant number of studies examining the effects of economies of scale in specific industries [1, 4–8] and areas of societal activity [9–13], as well as its relationship with indicators such as economic growth [14], labor productivity, and capital intensity [15, 16].
For modern Russia, economies of scale hold particular importance, as they play a critical role in expanding existing production capacities and restoring technological sovereignty. However, relying solely on economies of scale is insufficient for determining investment priorities. Other factors must also be taken into account.
There is extensive academic research dedicated to substantiating and exploring the criteria and principles for selecting investment priorities. For instance, it is proposed to consider their impact on factors such as aggregate supply and demand, the state of the social and natural environment, budget revenue formation, the utilization of domestic resources, and the presence of a multiplier effect. Decision–making is recommended to adhere to principles of targeted focus, the specific importance of certain investments for the socio–economic development of a region, systematicity, comprehensiveness, rationality, efficiency, and manageability [17, 18].
In regional investment strategies, the selection of priorities is primarily guided by two criteria:
1. The existing structure and level of development of industries in the region.
2. The potential for achieving a systemic development effect in the industry, as reflected in its impact on the socio–economic indicators of the territory [19].
For example, the criteria for establishing sectoral priorities in the Investment Strategy of the Tula Region until 2030 include investment openness, the condition of fixed assets, workforce availability, resource base, scientific and technical infrastructure, and administrative and tax regimes. [1]
The Investment Strategy of the Voronezh Region for the period up to 2020, with key directions outlined until 2030, focuses on scalability, multiplicative and long–term effects, growth of added value, and innovation. [2] In conditions of federal, regional, and local budget deficits, as well as low solvent demand, the selection of sectoral priorities primarily aims to define the sectoral structure of investments and the significance of production for the region’s vital functions [20].
In international literature, the methodology for evaluating sectoral investment priorities often employs the concept of key sectors, described by A. Hirschman in 1958. This concept is based on the hypothesis of reciprocal interconnections between key industries and the broader economy [21]. Today, modern modifications of this concept are also available [22, 23]. Widely used and further developed methodologies include those based on Saaty’s Analytic Hierarchy Process, input–output balance models, and the coefficient of innovation induction [24], as well as algorithms focused on identifying the most profitable projects to maximize returns [25].
The Russian practice encompasses a wide range of approaches to determining sectoral investment priorities. In particular: I. Kovaleva’s methodology focuses on evaluating indicators of investment potential, risk, and sectoral activity [26]. N. Sinyak suggests using the traditional method of discounting cash flows [27]. V. Moskovkin’s approach involves comparing indicators such as the share of foreign investments, their volumes, and growth rates in the industry both regionally and nationwide [28]. A. Panyagina’s methodology assesses the alignment of sector development with the interests of key investors by analyzing growth rates of profits, production volumes, sales, investments in fixed assets, and prices. The proximity of these dynamics to normative values is determined using Spearman and Kendall coefficients, along with a composite coefficient [24, 29]. E. Popova’s method provides an integral evaluation of sectoral investment priorities by first calculating the investment attractiveness of industries and then determining their priority using hierarchical analysis [30].
Thus, all existing methodologies for identifying sectoral investment priorities can be classified based on their primary focus [30]:
— investment attractiveness of the sector, where evaluations are conducted in the framework of “investment potential/investment risk,” incorporating economic and risk parameters.
— multiplicative effect of the chosen priority on other industries.
— return on investment, emphasizing the efficiency of invested funds.
— actual investment activity, reflecting faster growth in sectoral investments at the regional level compared to national trends.
— alternatives close to the ideal (normative) solution, which involve analyzing large datasets to identify differences between indicator groups, calculating composite indicators, and ranking sectors accordingly.
In addition, there are integrated methodologies that combine all of the above approaches.
Investment priority selection approaches are also widely represented in intra–sectoral aspects. For example, to analyze investment priorities in transitioning to renewable energy in developing economies, the multi–criteria group decision–making methodology is applied. This method evaluates twelve criteria across four aspects: regulatory frameworks for increasing renewable energy potential, supply of renewable materials, incentives for private sector investors in renewable energy, and awareness of renewable energy consumption [31]. For investment decision–making in the tourism sector, the method for impact assessment of programmes and projects is suggested. This approach helps determine the influence of investment activities on each development indicator of the territory [32]. Strategies for attracting investments in agricultural land use involve creating a system of eco–economic evaluation of investment quality, where, in addition to economic indicators, the environmental factor must be considered. Neglecting this factor can lead to errors regarding the eco–economic optimality of investment decisions [33].
Given the above, it is necessary to establish several key macroeconomic characteristics: first, we need to determine projected production growth in prioritized regional–territorial clusters. Secondly, we need to estimate potential labor productivity growth, driven by the anticipated production expansion and economies of scale. Thirdly, we need to calculate the investment volume required to achieve these outcomes. These characteristics must be assessed at macro–, meso–, and sectoral levels. The output should include a set of indicators for each selected (both priority and lagging) region within the agricultural sector, as well as for the Russian economy as a whole, incorporating the aggregated results from all evaluated regional clusters. The realization of these technological effects is expected in the medium term, spanning 2–3 years, and thus necessitates the implementation of a relatively prompt macroeconomic policy.
It is important to emphasize that the focus here is on existing agricultural complexes in the regions, as launching new enterprises from scratch requires entirely different analytical and regulatory frameworks, which fall outside the scope of this discussion [2].
ECONOMIES OF SCALE: METHODOLOGY AND EMPIRICAL ESTIMATES
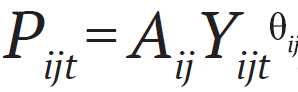
The economies of scale can be understood, in general terms, as the phenomenon where an increase in production volume (Y) leads to a decrease in unit costs, equivalent to improved production efficiency. For the purposes of this analysis, production efficiency can be adequately represented by average labor productivity (P), defined as: P = Y/L, where L is the number of workers employed in production. Economies of scale are present when the following condition holds: dP/dY > 0; If this condition is not met, economies of scale are absent [2].
To provide clarity, we assume the relationship between labor productivity and production scale follows a power function, which is a traditional representation in economic analysis:
 (1)
(1)
where: Pijt is labor productivity in the i–th in–dustry, j–th region at time t (year), Yijt is the output volume in the i–th industry, j–th region at time t, Aij,and θij are parameters of the function.
If θ > 0, economies of scale are present. The larger the value of θ, the stronger the effect of economies of scale.
In addition to the economies of scale that determine the technological reserves of a group of enterprises in a region, it is also necessary to consider the technological level already achieved by the enterprises. These two factors of production should be analyzed together, which can be done by aggregating the two effects through simple multiplication [2]:
 (2)
(2)
where Pij0 , PM0 and PijT are labor productivity of the i–th industry in the j–th region at the initial time t = 0, average labor productivity across the country at the initial time t = 0 and labor productivity of the i–th industry in the j–th region after production expansion over T years; λij. is planned growth rate of the i –th industry’s production in the j –th region as a result of investments in business expansion.
If the region’s initial labor productivity is higher than the national average (Pij0 > PM0), combined with a significant scale effect (θjj > 1) and substantial investments to ensure a notable increase in production (λjj > 0), the economies of scale can drive a significant technological leap forward. When such results are achieved in multiple regions simultaneously, it can be said that the country has developed a cluster of high–tech enterprises comparable to leading international industries.
The structural effect will be denoted as Ωij = PijT /PM0. Based on this indicator, it is advisable to rank regions according to their technological prospects.
Table 1. Advanced agrarian regions of Russia, based on the criteria of scale effect and labour efficiency
|
No |
Region |
Model |
Scale effect, θj |
Рj0/Pм0 |
|
1 |
Kursk region |
lnP = –10.65 + 1.61 lnY |
1.61 |
2.23 |
|
2 |
Oryol region |
lnP = –15.43 + 2.22 lnY |
2.22 |
2.73 |
|
3 |
Tula region |
lnP = –6.39 + 2.22 lnY |
2.22 |
1.46 |
|
4 |
Penza region |
lnP = –11.19 + 1.69 lnY |
1.69 |
1.68 |
|
5 |
Saratov region |
lnP = –22.99 + 2.79 lnY |
2.79 |
1.63 |
|
6 |
Sverdlovsk region |
lnP = –41.75 + 4.83 lnY |
4.83 |
1.07 |
|
7 |
Amur region |
lnP = –5.60 + 1.23 lnY |
1.23 |
2.10 |
Source: calculated by the authors.
Note: n – number of observations; R2– coefficient of determination; DW – Durbin–Watson coefficient; A – approximation error; d – dummy – variable that takes the values 0 and 1; values of their t–statistics are shown in parentheses under the regression coefficients.
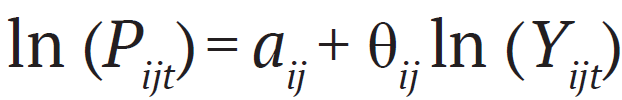
To identify economies of scale, econometric dependencies were constructed for all regions of Russia based on a universal specification in the form of a logarithmic relationship (1):
 (3)
(3)
where P and Y are, as before, labor productivity and the volume of output produced.
The agricultural sector is considered in an aggregated form, which includes not only agriculture but also fisheries and forestry. The retrospective calculations cover the period from the beginning of the 21st century to 2022, inclusive. Official data from Rosstat, presented in the Unified Interdepartmental Information and Statistical System (EMISS), as well as in the statistical yearbook “Regions of Russia. Socio–Economic Indicators”, were used for the calculations.
In the study [2], a comprehensive econometric assessment of the relationship (3) was conducted for the agricultural sector across all regions of Russia. Based on these calculations, 7 regions with the most promising structural effects Ω were identified, assuming that the projected industry growth rate for each region is λ=0.5. Data for these most promising regions, including the econometric models, are presented in Table 1. (since all calculations were conducted for one industry, the index i will be omitted henceforth). All the models presented pass the basic statistical tests and can be used for applied and analytical calculations.
From the table, it is clear that the 7 selected regions not only have an acceptable initial level of labor productivity but also significant technological reserves related to economies of scale. These regions will henceforth be referred to as leading.
Although the selection of priority regional–industrial segments of the Russian agricultural sector represents a step forward in investment decision–making, it does not solve all the problems. First, questions remain about what growth rate of output (λ) is most preferable in these segments to achieve a visible technological breakthrough. Secondly, it remains to be determined what financial sacrifices are required to achieve these results. Both of these issues are closely interlinked and can be addressed within a corresponding methodological framework.
FACTOR OF INVESTMENT CAPACITY IN PRODUCTION
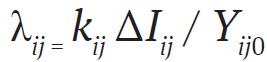
To address the task, we will use the concept of “capital return” or, more precisely, “output per unit of investment in fixed capital” – k = Y/I, where: Y is the output of the industry in the region for the corresponding year, I is the volume of investment in fixed capital for the corresponding year, k is the average return on investment in fixed capital. If we abstract from the differences between average and marginal values, the indicator к is essentially equivalent to the investment multiplier in Keynesian theory. Therefore, the projected increase in output for the i–th industry in the j–th region is related to the planned volume of investments in that industry through the elementary formula:
 (4)
(4)
The expected rate of growth in output in formula (2) is determined as follows:
 (5)
(5)
where Yij0 is the volume of output at the initial point in time.
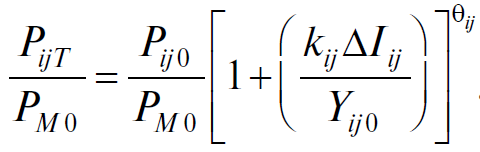
Therefore, depending on the planned capital investments in the agricultural sector of the region, technological progress will be determined by the final formula:
 (6)
(6)
Of course, using formula (5), the reverse problem can be solved to determine the required volume of investments for the projected rate of output growth λ. For simplicity in analysis and comparability of results, we will assume, as before, that the relative growth rate of output λ = 0.5 is the same across all regions. We are not concerned with the time it will take to achieve this result; what matters is the result itself, with the possible caveat that it will be achieved in 1, 2, or 3 years. Substantively, this will not change the technological and investment preferences identified.
Since formula (6) allows us to determine not only the structural effect Ω but also the increase in production and investment, it is necessary to have an understanding of the final production and investment picture for the regions under consideration:
 (7)
(7)
 (8)
(8)
where m is the number of regions in the considered production cluster.
The proposed method, despite its simplicity, allows for solving a wide range of tasks. For example, one can evaluate the dependence of the structural technological effect on targeted investment, economic growth based on the adopted investment program, or determine how much investment is required for the projected production volumes. Here and further, we will limit ourselves to the simplest and most natural formulation of the problem – determining the structural technological effect in the regions, as well as the required increases in production and capital investments for fixed economic growth.
ACCOUNTING FOR THE INVESTMENT FACTOR: ASSESSMENT OF THE ACTUAL SITUATION
For correct identification of investment multipliers, we will use the data from Table 2 (as in Table 1, the industry index is omitted since only the agricultural sector is considered). The analysis of the provided figures allows for a number of key conclusions, which will form the basis for further exploration of the issue.
Table 2. The evolution of the agricultural investment multiplier (kjt) in advanced Russian regions
|
Year |
Sverdlovsk region |
Oryol region |
Saratov region |
Kursk region |
Tula region |
Amur region |
Penza region |
RF |
|
2000 |
19.9 |
12.5 |
29.2 |
36.5 |
19.8 |
80.6 |
20.1 |
23.6 |
|
2001 |
20.3 |
12.4 |
28.9 |
25.6 |
26.5 |
75.7 |
14.0 |
19.7 |
|
2002 |
17.3 |
13.9 |
29.7 |
23.2 |
19.3 |
50.7 |
15.5 |
12.5 |
|
2003 |
17.0 |
11.4 |
28.9 |
19.3 |
13.2 |
28.6 |
11.9 |
12.3 |
|
2004 |
17.5 |
9.1 |
26.0 |
12.7 |
11.9 |
44.4 |
13.1 |
11.5 |
|
2005 |
16.3 |
15.4 |
34.5 |
15.2 |
11.6 |
17.6 |
10.8 |
9.9 |
|
2006 |
11.4 |
5.4 |
28.6 |
7.6 |
9.5 |
12.1 |
10.3 |
7.0 |
|
2007 |
7.1 |
3.1 |
18.8 |
7.3 |
8.6 |
11.9 |
7.9 |
5.5 |
|
2008 |
7.1 |
4.4 |
19.2 |
14.0 |
10.4 |
16.8 |
6.9 |
6.1 |
|
2009 |
10.1 |
6.5 |
21.0 |
18.2 |
13.7 |
22.5 |
6.4 |
7.6 |
|
2010 |
14.8 |
11.7 |
29.0 |
6.9 |
14.7 |
19.8 |
5.8 |
8.0 |
|
2011 |
11.4 |
12.4 |
30.3 |
4.6 |
10.1 |
12.9 |
5.8 |
8.2 |
|
2012 |
8.3 |
9.2 |
20.7 |
5.3 |
10.2 |
16.4 |
7.6 |
6.7 |
|
2013 |
9.3 |
10.8 |
22.4 |
5.0 |
11.4 |
7.2 |
7.8 |
7.1 |
|
2014 |
13.6 |
13.4 |
27.4 |
13.4 |
25.7 |
24.6 |
6.3 |
8.0 |
|
2015 |
17.9 |
15.4 |
36.1 |
13.2 |
10.6 |
15.0 |
6.2 |
8.9 |
|
2016 |
15.2 |
12.1 |
32.5 |
6.7 |
9.6 |
15.8 |
11.4 |
8.4 |
|
2017 |
8.0 |
8.0 |
30.5 |
7.8 |
10.0 |
20.9 |
6.1 |
11.5 |
|
2018 |
13.6 |
6.5 |
27.5 |
8.5 |
6.2 |
13.1 |
5.0 |
11.0 |
|
2019 |
15.7 |
7.7 |
47.7 |
6.9 |
5.2 |
12.8 |
6.4 |
10.7 |
|
2020 |
13.0 |
7.5 |
28.3 |
10.4 |
8.8 |
13.9 |
11.0 |
11.7 |
|
2021 |
15.2 |
7.8 |
28.9 |
10.3 |
8.8 |
15.2 |
12.8 |
12.2 |
|
2022 |
14.4 |
7.9 |
37.8 |
12.5 |
6.4 |
14.2 |
14.3 |
12.5 |
Source: calculated by the authors.
First, throughout the 21st century, the investment multiplier in Russia’s agricultural sector has been decreasing. Overall, from 2000 to 2022, it halved. This unequivocally indicates that agricultural production has become increasingly capital–intensive and costly over time and indirectly suggests the saturation of agriculture with more complex and expensive technologies.
Second, the difference in regional multipliers is quite significant. For example, in 2022, the value of this indicator in the Saratov region exceeded that of the Tula region by 31.4 points; the relative advantage between the two regions was nearly 6 times. Such large–scale discrepancies require an explanation considering the production specifics of the Russian regions, but the highly differentiated return on investments still raises concerns and represents a separate issue that goes beyond the scope of the discussion.
Third, despite all the challenges, regional inequality in the return on investments is decreasing. In 2000, the absolute difference between the multipliers of the Amur and Oryol regions was 68.1 points, and the relative difference was 6.4 times. Thus, at the beginning of the century, technological disparities in the sector were even more pronounced than they are today. This circumstance indirectly indicates technological diffusion occurring in the agricultural sector.
Fourth, there was no clear trend in the dynamics of the investment multiplier. For the sector as a whole, 2012 was a year of decline, but for different regions, the downturns occurred in completely different periods. Importantly, both for the sector as a whole and for all regions (except for the Tula region), two phases were characteristic: a decline in the return on investments followed by a subsequent recovery. At present, there are grounds to hope that the sector has entered a growth trajectory for the multiplier.
Fifth, the dynamic instability of the return on investments within regions exceeds even the differentiation between them. For example, in the Amur region, the absolute gap in the size of the multiplier in 2000 and 2013 was 73.4 points, and the relative gap was 11.2 times. In the Saratov region, the absolute gap in 2007 and 2019 was 28.9 points, and the relative gap in the Penza region in 2000 and 2018 reached 4.0 times. These facts indicate that technological renewal in the agriculture of Russian regions was largely spontaneous and lacked a clear trend.
Despite the challenges mentioned, it is important to note that in the last five reporting years (2018–2022), there was, firstly, a clear stabilization in the dynamics of the multiplier, and secondly, a slight and still unstable improvement in the situation. As a result, in the further calculations, we will use the averaged regional investment multipliers for these five years. As stated earlier, for the sake of calculation unification, we will assume a projected regional production growth of 50% (λj = 0,5). The base year for us is 2022, relative to which all applied calculations are made (at comparable prices). The results are presented in Table 3 (the multiplier and structural effect indicators have no units of measurement, reflecting the multiples of the respective ratios).
Table 3. The extent of investment required for technological leap in advanced regions
|
No |
Region |
Ωj |
kj |
ΔI, billion rubles |
ΔY, billion rubles |
|
1 |
Sverdlovsk region |
7.58 |
14.4 |
4.0 |
57.7 |
|
2 |
Oryol region |
6.72 |
7.5 |
8.9 |
67.0 |
|
3 |
Saratov region |
5.05 |
34.0 |
3.8 |
130.8 |
|
4 |
Kursk region |
4.28 |
9.7 |
12.2 |
118.9 |
|
5 |
Tula region |
3.59 |
7.1 |
7.8 |
55.3 |
|
6 |
Amur region |
3.46 |
13.8 |
3.1 |
43.0 |
|
7 |
Penza region |
3.33 |
9.9 |
8.4 |
83.0 |
|
TOTAL |
– |
– |
48.2 |
555.7 |
|
Source: calculated by the authors.
The analysis of the data in Table 3 indicates that the total volume of investments in fixed capital in 7 regions will require an amount of ΔI* = 48,2 billion rubles. This will result in an increase in sectoral production ΔY* = 555, billion rubles, which is equivalent to an overall sectoral growth rate of λ = 6.5%. Thus, this investment sum, directed only to the 7 leading regions, will significantly boost sectoral production growth in the country and will create a regional–sectoral cluster of enterprises with an average labor productivity that exceeds the 2022 level by 4.9 times. It can be concluded that such a cluster will match the best global enterprises in its sector.
Let us ask the question: is such an “investment sacrifice” excessive? Calculations show that the required volume of investments p will amount to only 7.1% of the total volume of investments in fixed capital in Russia’s agricultural sector in 2022 (here and further, μ denotes the growth rate of investments in fixed capital). In other words, such an investment loss is clearly justified by the potential to create an advanced technological cluster in the country’s agricultural sector.
The figures obtained are largely symbolic; however, for a better understanding of the situation, we will conduct additional calculations with a control group. For this, we will consider another 7 regions, which we will call catchingup regions – they are characterized by much more moderate values of the scale effect and relative labor productivity (Table 4).
Table 4. The evolution of the agricultural investment multiplier (kjt) in the context of catch–up development in Russian regions
|
Year |
Kabardino–Balkarian Republic |
Republic of Degestan |
Komi Republic |
Altai Republic |
Irkutsk region |
Transbaikal territory |
Primorsky Krai |
RF |
|
2000 |
94.8 |
22.8 |
21.4 |
16.6 |
30.8 |
104.8 |
36.1 |
23.6 |
|
2001 |
67.5 |
19.5 |
17.2 |
14.8 |
28.1 |
35.1 |
33.2 |
19.7 |
|
2002 |
42.5 |
38.0 |
11.3 |
19.4 |
25.3 |
68.4 |
10.3 |
12.5 |
|
2003 |
39.8 |
38.2 |
11.0 |
24.4 |
20.7 |
42.5 |
10.5 |
12.3 |
|
2004 |
113.5 |
31.4 |
17.9 |
25.0 |
22.7 |
43.5 |
12.5 |
11.5 |
|
2005 |
264.7 |
45.2 |
5.5 |
31.5 |
21.1 |
68.3 |
8.8 |
9.9 |
|
2006 |
158.7 |
83.2 |
2.3 |
29.9 |
12.5 |
40.2 |
9.0 |
7.0 |
|
2007 |
34.5 |
103.4 |
4.3 |
26.2 |
11.6 |
26.6 |
9.7 |
5.5 |
|
2008 |
147.5 |
146.2 |
5.0 |
33.3 |
7.7 |
56.7 |
11.4 |
6.1 |
|
2009 |
19.3 |
87.0 |
6.5 |
44.3 |
17.8 |
63.3 |
21.1 |
7.6 |
|
2010 |
37.6 |
186.5 |
6.8 |
68.1 |
21.1 |
61.5 |
26.8 |
8.0 |
|
2011 |
37.2 |
121.0 |
6.0 |
25.9 |
16.6 |
63.6 |
18.0 |
8.2 |
|
2012 |
120.3 |
240.6 |
7.7 |
37.3 |
12.6 |
107.4 |
17.8 |
6.7 |
|
2013 |
60.3 |
28.0 |
8.7 |
62.5 |
18.3 |
109.3 |
12.9 |
7.1 |
|
2014 |
11.9 |
189.9 |
8.0 |
55.2 |
20.1 |
65.1 |
11.3 |
8.0 |
|
2015 |
14.9 |
158.8 |
9.7 |
76.3 |
15.0 |
210.1 |
12.7 |
8.9 |
|
2016 |
31.8 |
179.7 |
7.4 |
40.2 |
13.3 |
271.0 |
13.9 |
8.4 |
|
2017 |
17.8 |
99.2 |
6.9 |
82.4 |
9.2 |
76.8 |
5.0 |
11.5 |
|
2018 |
25.6 |
61.1 |
6.8 |
62.3 |
9.3 |
66.2 |
3.8 |
11.0 |
|
2019 |
47.8 |
38.6 |
4.7 |
56.0 |
8.7 |
33.5 |
2.4 |
10.7 |
|
2020 |
71.2 |
41.6 |
7.2 |
79.9 |
12.0 |
75.4 |
2.0 |
11.7 |
|
2021 |
49.4 |
38.8 |
10.0 |
75.2 |
9.5 |
45.9 |
2.9 |
12.2 |
|
2022 |
67.8 |
56.8 |
9.6 |
70.7 |
10.0 |
104.4 |
2.0 |
12.5 |
Source: calculated by the authors.
Without going into excessive details, it can be stated that the catching–up regions have much more impressive investment multipliers than the leading ones. For example, in 2000, the average value of the multiplier in the catching–up regions was 1.5 times higher than in the leading regions, and by 2022, it was already 3 times higher. Thus, a paradoxical rule can be derived: the less developed a region is, the higher its investment multiplier. Moreover, as shown above, this effect does not weaken over time but strengthens, which rules out the randomness of the established pattern.
The explanation for the identified paradox should be sought in the regional–sectoral specifics of production complexes, but the main thesis is as follows. Catching–up regions are extremely passive in investing in technological innovations in agricultural production, which leads to the conservation of their labor productivity at a low level. Accordingly, agricultural output is not so much driven by new technologies as by the natural potential of the region. For comparison, in 2000, the 7 leading regions invested 3.4 billion rubles in fixed capital, while the 7 catching–up regions invested 1.2 billion rubles; in 2022, these figures were 86.1 billion and 49.1 billion rubles, respectively. This shows that the leading regions focus on intensive development of agricultural production, while the catching–up regions rely on extensive growth.
Table 5. Scale of investment required for technological leap in catching–up regions
|
No |
Region |
Ω |
k |
ΔI. billion rubles |
ΔY. billion rubles |
|
1 |
Kabardino–Balkarian Republic |
0.73 |
52.4 |
0.8 |
42.2 |
|
2 |
Republic of Dagestan |
0.69 |
47.4 |
2.0 |
96.5 |
|
3 |
Komi Republic |
0.42 |
7.7 |
0.9 |
7.2 |
|
4 |
Altai Republic |
0.60 |
68.8 |
0.1 |
6.3 |
|
5 |
Irkutsk region |
0.71 |
9.9 |
4.1 |
40.2 |
|
6 |
Transbaikal Territory |
0.64 |
65.1 |
0.2 |
13.9 |
|
7 |
Primorsky Krai |
0.56 |
2.6 |
13.3 |
34.8 |
|
TOTAL |
– |
– |
21.4 |
241.1 |
|
Source: calculated by the authors.
Calculations for the catching–up regions are presented in Table 5. It shows that in the 7 regions, the total investment in fixed capital will need to be ΔI* = 21,4 billion rubles; this will ensure an increase in sectoral production of ΔY* = 241,1 billion rubles, which corresponds to an overall sectoral economic growth rate of λ = 2.8%. The required investment volume will constitute only μ = 3.1% of the total investment in fixed capital in Russia’s agricultural sector in 2022. All these figures are much more modest compared to the leading regions (assuming a 50% growth in agriculture across all Russian regions).
RESULTS AND DISCUSSION: EXPERIMENTATION AND REPLICATION
The results for the regional groups may be misleading since the first group performs better in some indicators, while the second group excels in others. For final conclusions, additional key macroeconomic characteristics are required for both regional groups (Table 6).
Table 6. Comparative macroeconomic features of two regional clusters
|
Aggregate figure |
Group of regions |
Ratio “leading/catching up” |
|
|
leading |
catching–up |
||
|
Ω |
4.86 |
0.62 |
7.84 |
|
k |
13.8 |
36.3 |
0.38 |
|
λ, % |
6.5 |
2.8 |
2.32 |
|
μ, % |
7.1 |
3.1 |
2.29 |
Source: calculated by the authors.
In the last column of Table 6, the indices of indicators for the corresponding regional groups are presented. For example, in terms of investment, leading regions are more costly than the lagging ones. However, stimulating their economic growth brings more significant results, slightly outweighing the high financial costs of such investments. The investment multiplier for lagging regions of the Russian Federation is much higher than that for leading regions, but this advantage is undermined by their enormous technological gap. This raises the key question: should we prefer effortless financial support for unpromising industries or costly support for leading production clusters?
Naturally, answers to this question may vary depending on initial political objectives and situational needs/opportunities. However, an objective consideration of all circumstances leans the balance in favor of supporting advanced industries. Let us explain this position with reference to the data in Table 6.
In Russia, the issue of labor shortages is already being raised at the highest levels. In this situation, labor productivity growth is the main, if not the only, way to address the existing chronic shortage of workers. This is the first and very significant argument in favor of stimulating high–tech regional–industrial production clusters. Otherwise, outdated agricultural production will “consume” all the available labor in the country.
The second problem facing modern Russia is overcoming the technological lag behind Western competitors. Therefore, local technological breakthroughs are needed to level the playing field in the confrontation with the collective West. In this sense, supporting the cluster of leading regions will allow them to increase labor productivity nearly fivefold compared to the current national average. At the same time, supporting lagging regions will result in their technological stagnation at a level slightly above half of the average industry labor productivity. This scenario means outright technological degradation, albeit slow but inevitable. This is the second argument in favor of supporting the leading regions.
The third problem is historically a weak point for the country – the colossal inequality between regions in terms of labor productivity. For example, in 2022, productivity in the Oryol region was almost 23 times higher than in the Leningrad region. Such a situation can no longer be tolerated, as the country risks fragmenting into territorially incompatible regions. At first glance, this situation should not stimulate further technological divergence between the leading regions and the rest of the Russian Federation, but this is a very superficial opinion. The fact is that the existing regional disparity in agricultural labor productivity has evolved spontaneously over decades or even centuries, depending on the geographical conditions of the respective regions. Today, this situation must change radically through the formation of advanced production clusters and the subsequent organization of the transfer of their technological achievements to other regions. Without organizing widespread borrowing of advanced practices, the issue of inequality cannot be resolved, whereas the presence of advanced productions provides a real foundation for large–scale technological diffusion across the country. This is the third strong argument for supporting high–tech clusters.
The fourth strategic problem is ensuring the fastest possible technological transformations. In this sense, supporting leading regions with solid economies of scale means rapidly utilizing existing technological and organizational reserves within already functioning and well–established productions. Any attempts to start from scratch by introducing advanced domestic or even foreign technologies are fraught with long timelines and unpredictable risks. This is the fourth argument in favor of selective investment policies supporting the best productions.
The nearly 8–fold gap in structural effects between the two regional groups (Table 6) speaks to the potential for technological stimulation in both investment programs. In the first case, Russia is forming a highly efficient production segment capable of transferring positive experiences, knowledge, and technologies to other regions. In the second case, the country effectively maintains the status quo, characterized as systemic technological lag. Strategically, the first case means building a two–level economy, where the higher–level sector conducts technological experiments and achieves high labor productivity as a result, while the lower–level sector borrows its experience. The first sector is more costly but strategically defining, while the second, with government support, should be provided the opportunity to widely benefit from others’ achievements.
Thus, the task of restoring the country’s technological sovereignty gives rise to investment strategies that were simply impossible in previous decades.
CONCLUSION
Modern Russia is going through difficult times. In such an environment, the country needs new or at least significantly modified investment strategies. The old doctrine, aimed at leveling the technological level of production across regions, has become outdated due to its inefficiency in extraordinary circumstances. In this regard, the article proposes an alternative strategy for determining investment priorities for Russia’s agricultural sector, one that takes into account the effect of initial conditions (the achieved relative technological level) and production technological reserves (economies of scale). Regions with the most impressive indicators in these areas should be classified as priorities for state and private investments.
The applied calculations conducted showed that there are seven leading regions in Russia’s agricultural sector (Sverdlovsk, Oryol, Saratov, Kursk, Tula, Amur, and Penza regions) that, with increased funding, can act as a high–tech cluster for the industry and reach the highest international standards. In the future, the progressive experience of enterprises in this cluster can be replicated to other regions, thus achieving cross–sector technology diffusion more efficiently. Otherwise, if investments are distributed relatively evenly, the technological leap in the leading regions will be delayed, and the rest of the industries will maintain their unacceptably low technological levels. Such a strategy would lead to technological stagnation in the sector, which is why it is necessary to abandon it in favor of a differentiated investment system.
For the successful implementation of the proposed analytical framework, it is necessary to examine subindustries in more detail. For example, the agricultural sector can be divided into crop farming, fisheries, and forestry. In these segments, the effect of scale may be highly differentiated, while practical proposals will be much more specific and productive. However, the most interesting area for application is replicating the proposed analytical approach for high–tech subindustries of manufacturing, where technological progress is particularly pronounced.
REFERENCES
1. Vasilyeva O.G., Bilko A.M. Evaluation of the scale effect in agriculture of the Amur Region. Prnstranstvennaya ekonomika = Spatial Economics. 2016;(2):104–122. (In Russ.). DOI: 10.14530/se.2016.2.104–122
2. Balatsky E.V., Ekimova N.A. Identification of economies of scale in regional–industrial production complexes of Russia: Theoretical foundations and econometric estimates. Journal of Applied Economic Research. 2024;23(2):394–421. (In Russ.). DOI: 10.15826/vestnik.2024.23.2.016
3. Miloshevskaya E.V. Economies of scale of production: concept, composition, quantitative measurement. Obshchestvo i ekonomika = Society and Economy. 2012;(9):35–47. (In Russ.).
4. Derevyanov M.Yu. Analysis of resource potential of objects of oil–contaminated wastes recycling system with variable scale effect. Vestnik Astrakhanskogo gosudarstvennogo tekhnicheskogo universiteta. Seriya: Upravlenie, vychislitel’naya tekhnika i informatika = Vestnik of Astrakhan State Technical University. Series: Management, Computer Science and Informatics. 2023;(3):65–75. (In Russ.). DOI: 10.24143/2072–95022023–3–65–75
5. Golubev S.S., Ivanus A.I., Mushkov A.Yu., Tsivileva A.E. Algorithm for a mathematical model for rapid assessing the effect of scale in the coal industry. Innovatsii i investitsii = Innovation & Investment. 2023;(11):281–284. (In Russ.).
6. Zhang C., Cai X., Lin B. The low–carbon transition of China’s power sector: Scale effect of grid upgrading. Energy. 2023;285:129321. DOI: 10.1016/j.energy.2023.129321
7. Vatev Z.V. Influence of the scale effect upon the financial results of the banks in Bulgaria. Finance: Theory and Practice. 2017;21(4):88–99. DOI: 10.26794/2587–5671–2017–21–4–88–99
8. Backus D.K., Kehoe P.J., Kehoe T.J. In search of scale effects in trade and growth. Journal of Economic Theory. 1992;58(2):377–409. DOI: 10.1016/0022–0531(92)90060–U
9. Balatsky E.V., Ekimova N.A. Identifying regional foci of potential geopolitical activity on the basis of demographic scale effect. Economic and Social Changes: Facts, Trends, Forecast. 2023;16(5):138–154. DOI: 10.15838/esc.2023.5.89.8 (In Russ.: Ekonomicheskie i sotsial’nye peremeny: fakty, tendentsii, prognoz. 2023;16(5):138–154. DOI: 10.15838/esc.2023.5.89.8).
10. Ng T., Pan Sh., Shi K. Diversity and scale effects. Applied Economics Letters. 2012;19(16):1–6. DOI: 10.1080/13504851.2011.648314
11. Mourao P., Enes C. Costs and economies of scale at not–for–profit organizations: The case of the Santa Casa da Misericordia de Barcelos between 2002 and 2013. Social Indicators Research. 2017;132(2):821–840. DOI: 10.1007/s11205–016–1315–4
12. Philippova A.V. Digitalization and the economies of scale in Russian NPOs. Ekonomicheskaya politika = Economic Policy. 2022;17(1):34–63. (In Russ.). DOI: 10.18288/1994–5124–2022–1–34–63
13. Kirdina S., Rubinstein A. The effects of path dependence and economy of scale in Russian legislature. VoprosyEkonomiki. 2014;(11):58–82. (In Russ.). DOI: 10.32609/0042–8736–2014–11–58–82
14. Balatsky E.V., Yurevich M.A. Technological economies of scale and economic growth. Terra Economicus. 2020;18(1):43–57. (In Russ.). DOI: 10.18522/2073–6606–2020–18–1–43–57
15. Safiullin A.R. Influence of industrial concentration and effect from scale on labour productivity. Audit i finansovyi analiz = Audit and Financial Analysis. 2009;(3):103–106. (In Russ.).
16. Dollar D. Economic reform and allocative efficiency in China’s state–owned industry. Economic Development and Cultural Change. 1990;39(1):89–105. DOI: 10.1086/451855
17. Semenov A.N. Substantiation and choice of priorities of investment in economy of region. Biznes v zakone = Business in Law. 2010;(4):220–222. (In Russ.).
18. Gubanova E.S. Justification and selection of investment priorities in the regional economy. Vologda: Vologda Scientific Coordination Center of CEMI RAS; 2002. 103 p. (In Russ.).
19. Panyagina A.E. Criteria for selecting priorities for investment development of a region. Dostizheniya vuzovskoi nauki. 2016;(20):246–251. (In Russ.).
20. Kitieva M.I., Ortskhanova M.A., Polonkoeva F.Ya. Basic criteria for the selection of the priorities of investment policy in the region. Colloquium–Journal. 2018;(13–10):33–35. (In Russ.).
21. Hirshchman A.O. The strategy of economic development. New Haven, CT: Yale University Press; 1958. 217 с.
22. Pirasteh H., Karimi F. Investigating priorities in Iran’s economic sectors: Application of input–output table. Iranian Economic Review. 2005;10(14):119–162. DOI: 10.22059/IER.2005.30897
23. DePaolis F., Murphy Ph., De Paolis Kaluza M.C. Identifying key sectors in the regional economy: A network analysis approach using input–output data. Applied Network Science. 2022;7:86. DOI: 10.1007/ s41109–022–00519–2
24. Panyagina A.E. Selection of industry priorities for investment development of regions. Sborniki konferentsii NITS Sotsiosfera. 2016;(28):87–91. URL: https://elibrary.ru/download/elibrary_26097486_42464272.pdf (In Russ.).
25. Kiani E., Shirazi M., Ramezanu E., Gilaninia Sh., Mousavian S.J. Determine comparative advantage of investment in different industries through TOPSIS technique. Journal of Basic and Applied Scientific Research. 2012;2(1):802–806.
26. Kovaleva I.V. To the issue of methodology and methods of investment attractiveness evaluation. Vestnik Altaiskogo gosudarstvennogo agrarnogo universiteta = Bulletin of Altai State Agricultural University. 2014;(5):166–170. (In Russ.).
27. Sinyak N.G. Comparative assessment of investment attractiveness of economic sectors using the assessment of the current value of the business. Trudy BGTU. Seriya 5: Ekonomika i upravlenie = Proceedings of BSTU. Series 5: Economics and Management. 2010;(7):12–15. (In Russ.).
28. Moskovkin V.M., Munoz A. The analytical tool for identification of sectoral priorities of foreign investments on the regional level: Evidence from the regions of the Russian Federation’s Central Federal District. Ekonomika, predprinimatel’stvo i pravo = Journal of Economics, Entrepreneurship and Law. 2015;5(3):95–108. (In Russ.). DOI: 10.18334/epp.5.3.2046
29. Panyagina A.E., Beketova A.M. Study of the region’s sectoral investment priorities on the basis of the targeted approach. Rossiiskoe predprinimatel’stvo = Russian Journal of Entrepreneurship. 2015;16(18):2958–2976. (In Russ.). DOI: 10.18334/rp.16.18.1943
30. Popova E.M. Evaluation of industry investment priorities at the regional level. Trendy i upravlenie = Trends and Management. 2018;(3):65–82. (In Russ.). DOI: 10.7256/2454–0730.2018.3.26522
31. Rawat S.S., Komal K., Dincer H., Yuksel S. A hybrid weighting method with a new score function for analyzing investment priorities in renewable energy. Computers & Industrial Engineering. 2023;185:109692. DOI: 10.1016/j.cie.2023.109692
32. Plzakova L. Evaluation of investments in the tourism sector with a local focus. Evaluation and Program Planning. 2022;94:102151. DOI: 10.1016/j.evalprogplan.2022.102151
33. Pak Z.Ch., Tuguz R.Kh. Innovative approaches to support investment decisions in agricultural land use based on the ecological–economic system. Rossiiskii ekonomicheskii internet–zhurnal = Russian Economic Online Journal. 2018;(4):85. (In Russ.).
34. Balatsky Е.V., Ekimova N.А. Monetary policy on launching new production facilities in Russia: Opportunities in the semiconductor market. Upravlenets = The Manager. 2023;14(5):16–28. DOI: 10.29141/2218–5003–2023–14–5–2
[2] URL: https://www.invest-in-voronezh.ru/ru/gosudarstvennaya-podderzhka/federalnyij-standart/investiczionnaya-strategiya
Official link to the paper:
Balatsky E.V., Ekimova N.A. Investment Priorities for Technological Breakthroughs Based on Scale Effect // «The World of New Economy», 2024. Vol. 18, No. 3. Pp. 17–32.