
Introduction
The modern general social evolution theory attempts to interpret the driving forces and mechanisms of human development or degradation, including such aspects as economic growth rates. However, many of the results obtained in this field are hypothetical and require empirical verification. Most present–day social evolution theories tend to be based on system–wide approaches that are commonly applied for complex systems of any nature. One such approach is represented by the polycausal social evolution (PCSE) concept (Balatsky, 2021a) based, in contrast to the traditional causal optics, on the structural principle. The core PCSE aspect is competition resulting from the self–assembly of a social system. Its effectiveness is manifested in the consistency principle (CP), according to which social progress and economic growth stem from the interaction of technological, institutional, and cultural development factors.
The PCSE concept is in line with modern approaches to modeling complex systems, and at a qualitative level its postulates are quite consistent with the observed phenomena (Balatsky, 2021a). However, in the absence of a reliable empirical basis, the PCSE remains a purely hypothetical analytical construct. The purpose of this paper is to formalize the CP and econometrically verify it using large arrays of statistical data. The general hypothesis of the study can be formulated as follows: a country’s economic growth rate positively correlates with the consistency in the development of three groups of factors: cultural, institutional, and technological ones; an imbalance in the development of the three above areas hinders economic growth.
The Consistency Principle in Social Development Theory
Different variations of the CP have been discussed in the academic literature for quite a long time. Almost all researchers note four social development factors: technology, institutions, culture, and geography; what is different is which of them is considered the key one at a particular development stage. However, these factors’ subsequent interactions were taken into account by practically all authors. For example, according to Marx, technology was the dominant development factor, while the CP manifested in the match between “productive forces” (technologies and workers [1]) and “production relations” (institutions) (Marx, Engels, 1960). Max Weber linked development to a spiritual factor, namely Protestant ethics (culture) to which institutions and technologies adapted (Weber, 1930). For Francis Fukuyama, the cultural factor of trust underlies all social and economic change (Fukuyama, 1995). Lev Gumilev believed the level of the nation’s “passionarity” (culture) determined by geography to be the source of historical development, which adapts the surrounding landscape by means of technology to match its needs (Gumilev, 2016).
Correlation between these factors is a key aspect of modern approaches in the social development theory. For example, (Welzel, 2013; Lal, 1998; Petrakis, 2014) pay special attention to emancipatory values (culture as individuals’ aspiration for freedom), which give rise to effective institutions, release people’s creative abilities, and lead to technological progress. In the framework of this approach, the concept of “culture as an economy” (Ramocka, 2010) was developed. A broad understanding of culture (Karimzadi, 2019; Van Der Borg, Russo, 2005) implies considering its “history–conditioned exogenous component”: assessing and analyzing the correlation between this component and the regional economic development (in particular, in Europe) (Tabellini, 2010). Despite similar natural conditions, US regions populated by Catholic German settlers employed a completely different model of agriculture, had a very different property structure and female fertility rate compared to colonists in other ethnic groups, and these differences remained in place for more than a century (Guiso et al., 2006).
According to Jared Diamond, all cultures, and their respective institutions and technologies are the result of adapting to basic geographic (natural) factors (Diamond, 1997). There is empirical evidence that suggests that the dominance of market (“Western”) or non–market (“non–Western”) institutions in different countries is determined by a narrow set of climatic characteristics (Kirdina–Chandler, 2018).
Daron Acemoğlu and James Robinson assign a crucial role in social development to the institutional factor directly reflected in a society’s technological and cultural models (Acemoglu, Robinson, 2012; North et al., 2009). In a later study they supplemented their institution formation theory with a mechanism of (mis)match in the development of centralized power and civil society (Acemoglu, Robinson, 2019).
A broader view of the CP as interconnected changes in several groups of social development factors (institutional, technological, cultural ones, etc.) was gradually developed by Victor Polterovich (Polterovich, 2002; Polterovich, 2016a). He sees the mechanisms for coordinating actors’ interactions as the basis of modern social evolution theory (Polterovich, 2016b), with the assumption of related changes in various other factor groups (Polterovich, 2018a, 2018b). In other studies, the CP was initially described as a conformity (concurrence) principle: “...economic growth requires effective institutions, but there also must be rather strict conformity between the technological, institutional, and cultural development levels” (Balatsky, Pliskevich, 2017). Somewhat later the CP was finalized in the following form: “economic growth rates are positively correlated with the degree of consistency between the level of wellbeing, and the development of technological, institutional, and cultural factors in the country. On the contrary, a mismatch between the maturity of these factors negatively affects economic growth” (Balatsky, 2021b). The cited work attempted to formalize and qualitatively verify the CP on the basis of several countries’ modernization experiences. However, no quantitative verification of the CP concept has yet been undertaken, which leaves the question of its validity open.
As for the terminology, since in natural sciences, principles and laws are very much universal, the CP must hold true always under any conditions. However, in social sciences, such terms lose their rigor, and under some conditions allow for certain deviations from the given parameters. Hereinafter we will adhere to a less rigorous social interpretation of the CP; this would require renaming it into a synchronization mechanism, but it seems appropriate to maintain terminological continuity.
Another limitation for this study is the fact that stating the CP holds or does not hold true can only be based on reliable observations of such highly abstract phenomena as culture, institutions, and technologies. In empirical studies, these categories are replaced by specific indicators which only partially reflect the phenomenon being measured. Thus, even a definitely established principle by means of econometric calculations, CP violation does not provide a final and exhaustive answer to the posed question. There is always a possibility that the use of better variables would affect the effect in question. The subsequent conclusions should be seen with this caveat in mind.
Finding Proxy Variables: an Overview of Approaches
Assessing the CP in the proposed wording turns out to be a sufficiently difficult task, since it requires building an econometric model of economic growth with generalized variables such as culture, institutions, and technologies (the geographical factor was excluded from consideration, and wellbeing taken into account indirectly). Next, we will consider the statistical aggregates which can serve as proxy variables for these three groups of factors.
Starting with Robert Solow’s work of the 1950s (Solow, 1956; 1957), technological progress has become an integral element in the majority of social development models, assessed in many different ways. The traditional measurement mechanism based on calculating total factor productivity is subject to well–substantiated criticism (Van Beveren, 2012; Reati, 2001). A popular measure of technological progress is the number of patents issued for inventions, and of innovations brought to market (Acs et al., 2002). Statistical data analysis provides increasingly more evidence for such an obvious consequence of technological development as labor productivity (LP) growth (Fagerberg, 2000; Giordano et al., 2017). The choice of this proxy variable for technological progress is usually determined by the time period under consideration, the availability and quality of data, and the specific features of the economic growth model applied (Sargent and Rodriguez, 2000). This approach seems to be optimal for assessing the level of production technologies.
The institutional factor of economic growth has attracted close attention from researchers since the early 1990s. The US economist Douglas North proposed a theoretical framework for analyzing the impact of institutions’ quality on economic development based on incentives (North, 1991; 2010). Dani Rodrik, on the contrary, believed institutions’ impact on aggregate output growth was indirect, and only took it into account as an exogenous economic development factor (Rodrik, 2003). Subsequent discussions focused on identifying the most effective institution types, and comparing their impact with that of geographic, climatic, and socio–cultural factors (Cvetanović et al., 2019; Urbano et al., 2019).
There is complete consensus among economists regarding the role the quality of the institutional environment plays in accelerating economic growth. Pluralism of approaches is mainly observed regarding specific ways of quantifying the institutional factor. The most popular ones are based on using composite indices combining several assessment areas (aspects of social life) with quantitative and qualitative indicators (Tvaronavičienė, Grybaitė, 2012). Typically, such indices are applied to four types of institutions: legal (Heritage Foundation Index of Economic Freedom, International Country Risk Guide, World Bank Worldwide Governance Indicators), regulatory (EBRD Transition Indicators), human capital development (UN Human Development Indicators, World Bank Knowledge Economy Index), and economic coordination and risk sharing ones (credit ratings) (Freinkman et al., 2009). The Ease of Doing Business Index (DB) turned out to be very suitable for use in growth models due to its universal nature and wide coverage of institution types (Haidar, 2012; Messaoud, Teheni, 2014). Some models use several institution quality indices (see, e.g., (Vanino, Lee, 2018)). The DB index appears to be the most effective institution quality indicator meeting the requirements for proxy variables.
Weber’s idea of cultural determinants’ role in economic development found wide application in macroeconomic models. Assessing cultural factors, finding the best ways to adequately quantify them, and analyzing their correlation with the state of national economy is seen as particularly important in present–day studies. For example, the World Values Survey extensive statistical database became the basis of the Achievement Motivation Index which reflects the values parents instill in their children: resolve and parsimony versus obedience and religiousness (Granato et al., 1996). A sample of 25 countries was analyzed to reveal the positive impact of a “can do” mindset on average economic growth rates. The same results were obtained when such people’s qualities as independence and responsibility were included in the value index (Marini, 2004). Similar conclusions were made regarding the respondents’ values: trust, respect, and personal freedom turned out to have a positive correlation with the average economic dynamics, while obedience had a negative one (Tabellini, 2010). Generally, linking the values studied in the framework of major surveys (such as the European Values Study (EVS), the Dimension Data Matrix (Hofstede data set), the GLOBE Project, the Schwartz Value Survey (SVS), etc.) with the overall cultural level (Masella et al., 2019; Petrakis, 2014) has become a common feature of macroeconomic models. At the same time the sporadic nature of surveys significantly limits the temporal and geographical scope of the analysis. A proxy variable reflecting more frequent observations may help compensate for the incomplete data on the cultural level of the population.
Values and attitudes affect almost all spheres of life. In the economy, their role is reflected by the level of corruption. In societies with blurred social tenets and a tolerant, or even positive attitude towards illegal ways of accumulating wealth or obtaining benefits, a so–called “corruption culture” emerges, which is reproduced from generation to generation (Hauk, Saez–Marti, 2002). This thesis has been repeatedly confirmed by abundant empirical evidence. In particular, cultural factors expressed in the results of value surveys in non–communist countries explain about 75% of the variance in the Corruption Perceptions Index (CPI) values (Sandholtz, Taagepera, 2005). A strong positive correlation was established between the CPI value and people’s sharing values such as risk and uncertainty aversion, masculinity, and power distance (Husted, 1999). The opposite (corruption deterring) effect was revealed for such values as social trust and respect for others, while individualism and leniency turn out to be pro–corruption factors (Mornah, Macdermott, 2018). Correlation between the level of corruption and cultural norms is manifested not only at the macro–level, but also for individuals and enterprises (Agyei–Mensah, Buertey, 2019; Barr, Serra, 2010). Despite all its limitations, the CPI can be seen as a valid proxy variable for the cultural level of the public.
Various combinations of the technology–institutions–culture triad have proven to be effective in modeling economic growth. According to Guido Tabellini’s calculations, institutions and values historically prevailing in five European countries turned out to be strongly correlated with the economic growth rates (Tabellini, 2010). Another study showed that unit value added created by small and medium–sized enterprises is indirectly correlated with the average per capita GDP of these firms’ country of residence, through informal and formal institutions (Ostapenko, 2015). The latter were measured using the Global Competitiveness Index (Institutions pillar) developed by the World Economic Forum, the Rule of Law Index, and the share of the shadow economy; informal institutions were measured via social norms and values. Modeling the impact of the Index of Economic Freedom and of a set of values revealed the strongest positive correlation when these factors are combined (multiplying the variables in the regression equation), though individually they also proved to be important in almost all specifications (Mathers, Williamson, 2011). Another study demonstrated a negative impact of corruption on economic growth through the erosion of the political system and violation of people’s rights (Mo, 2001). This thesis was confirmed in (Dridi, 2013) on a larger sample.
Thus, the approach which recognizes the importance of all three elements under consideration (institutions, culture, and technological progress) prevails in studying economic growth factors. However, their individual impact and multiplicative effect in specific cases may vary. One of the main problems with economic growth models is the endogeneity of variables (Marini, 2016). Various tools are applied to solve it: explanatory regressor lags; the instrumental variables method (Tabellini, 2010); structural equation modeling (Ostapenko, 2015); fixed effect panel data modeling (Góes, 2016); the method of moments (Nawaz, 2015). Depending on the combination of factors and theoretical constructs, the correlation between them (and the conclusions about causal relationships) vary greatly. The initial national or regional sample also significantly affects the robustness of results. In other words, national development models play an important role in modeling economic growth.
Generally, constructing an econometric model to explain economic growth rates in terms of three major groups of factors (cultural, institutional, and technological ones), measured by proxy variables such as LP, DB, and CPI, can be seen if not as a standard, then a quite common approach.
Formalizing the Consistency Principle and Source Data
The general hypothesis regarding the CP which is being tested here can be formulated as follows: economic growth rates are positively correlated with the degree of consistency of such factors as the level of the country’s wellbeing, and its technological, institutional, and cultural development (Balatsky, 2021b). A truncated set of factors will be considered below, with wellbeing and geographical characteristics excluded. The last group of factors mainly affects countries’ social evolution at early stages: in catching–up countries actively borrowing institutions and technologies, climate–related features are overwhelmed by other economic growth determinants (Polterovich, 2018a). As for the wellbeing factor, it will be taken into account indirectly – through the differences in the sample of studied countries.
Due to the highly abstract nature of such basic concepts as technologies, institutions, and culture we will briefly explain their meaning in the context of this study. Institutions mean social interaction mechanisms, or behavioral norms; culture means social values, ideals, and aspirations; and technology means all production process components including equipment and control systems. These very much notional definitions are still consistent with the modern scientific approaches, to an extent sufficient for meaningful analysis.
Taking into account the above reservations, in general terms the CP can be formalized as follows (Balatsky, 2021b):
 (1)
(1)
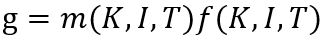
where K is the average level of the country population’s culture; T is the average level of the national economy’s technological development; I is the average level of institutions’ development (efficiency); g is the economic growth rate; and m is a metric of factors K, T, and I consistency.
The economic growth model (1) is a modified production function where economic activity is determined by labor, capital, and institutional productivity (f=f(K,I,T)), with an added accelerator m that reflects their mutual consistency (m=m(K,I,T)). Extending the traditional growth model in this way allows one to reconsider the hypothesis of a high, or even unlimited interchangeability of macro–factors in favor of their interdependence and complementarity.
Though function (1) can also be represented in an equivalent additive form, we will use it in a multiplicative one:
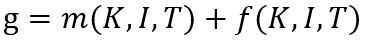 (2)
(2)
If instead of the macro–factors consistency metric we use the opposite metric of their mismatch D=D(K,I,T), equation (2) will look as follows:
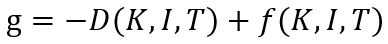 (3)
(3)
Any of the known distance metrics can serve as a measure of mismatch. To avoid ambiguity, we take D=D(K,I,T) as the sum of deviations from the arithmetic mean of the three factors (M), as the closest analogue of the dispersion index:
 (4)
(4)
 (5)
(5)
Equations (2) and (3) are equivalent, which becomes especially evident if, for example, coefficients m=–D (or m=1/D) are applied. For technical reasons form (3) was chosen as preferable.
Since the factors K, I, and T have completely different measuring units and value ranges, in the econometric model they are normalized as follows:
K=(PK–PKmin)/(PKmax–PKmin),
where PK is proxy variable of the cultural level in a particular country, while PKmax and PKmin are the reference maximum and minimum values of this variable in the analyzed sample of countries; the indicators I and T are normalized in a similar way.
The mismatch coefficient D is calculated for the factors’ normalized values. In which area should, for example, the PK factor be analyzed, is decided on the basis of country sample that allows one to set the interval (PKmin; PKmax); then the proxy variable PK is converted to a comparable scale, in fractions (0; 1) or in percentages (0; 100).
To test the general hypothesis about CP validity, econometric dependence (3) must be constructed and the parameters of the desired model assessed. For convenience, linear function (3) is presented as follows:
 (6)
(6)
where ρ, α, β, γ, θ and σ are parameters measuring each factor group’s impact, ψ is random error, and i is country index.
Verifying the CP requires compliance with the a priori conditions α>0, β>0, γ>0, and θ>0. In this case, an increase in the level of people’s culture, technological development, and the effectiveness of institutions leads to an increase in the economic growth rate, while, on the contrary, an imbalance of these three factors slows the growth down. Thus, the CP is valid if the four parameters in the econometric dependence (6) have positive values. This is the hypothesis that will be tested below.
As shown in the previous section, generalized factor groups such as culture, institutions, and technologies can be sufficiently accurately expressed by the corresponding proxy variables:
g→GDP; T→LP; I→DB; K→CPI,
where GDP is the annual GDP growth rate at constant prices in local currency [2]; LP is labor productivity (GDP per employee [3]); DB is the World Bank’s Ease of Doing Business Index (ranging from 0 to 100) [4]; and CPI is the Corruption Perceptions Index (ranging from 0 to 100) [5].
Though the selected proxy variables are notional, and do not reflect the relevant factors in their entirety and objective complexity, in the long term their dynamics coincide. For example, technological progress increases labor productivity, while the latter’s decline indicates profound flaws in innovation activities. A favorable business environment also does not fully reflect the country’s institutional complexity, but this does not mean the business climate can improve with poor–quality institutions. Similarly, the level of corruption certainly does not reflect the entire cultural diversity, but a general increase of the latter leads to a natural reduction in the scale of corruption. Thus, these proxy variables as reduced indicators of the factor groups under consideration are quite suitable for establishing the presence or absence of intra–system correlations.
A data array covering 154 countries from 2012 to 2019 was used in the econometric calculations; the total number of observations was 1,232. The use of panel data was due to the need to maximize the sample size. The relatively short time interval for such calculations is due to the limited availability of data on the CPI indicator: in 2012 the methodology for compiling it was changed so much that correct comparisons with data for previous periods became impossible. [6] The methods applied in subsequent calculations to take into account the time factor have largely neutralized the cycles in the variables’ dynamics. The analysis showed that the proxy variables chosen for the model were sufficiently sensitive, and to a certain extent susceptible to cycles; this allowed for synchronizing all variables over the economic cycle stages (which would not be guaranteed for less flexible culture and institutions proxy variables).
Due to the heterogeneity of the initial set of countries, they were broken down into four groups according to the World Bank’s per capita income criterion [7]: high income countries, upper middle income countries, lower middle income countries, and low income countries) (Table 1).
Table 1. Country Groups by Per Capita Income
|
Group number |
Country group |
Number of countries |
|
1 |
High income |
49 |
|
2 |
Upper middle income |
39 |
|
3 |
Lower middle income |
40 |
|
4 |
Low income |
26 |
|
5 |
Rich countries (No 1 + No 2) |
88 |
|
6 |
Poor countries (No 3 + No 4) |
66 |
|
7 |
Total (No 5 + No 6) |
154 |
Further aggregation allowed us to merge the four groups of countries into two: rich ones (all countries with higher than middle income) and poor ones (lower than middle income) (Table 1). Reducing the number of analysis objects to two allowed us, firstly, to obtain more firm statistical results, and secondly, simplify the interpretation of the existing dichotomy between country groups.
During the time period under consideration some countries in the sample moved from one group to another. To maintain the data panel’s integrity, a country was included in a particular income group on the basis of 2019 data; accordingly, each country remained in the same group throughout the entire time interval. This assumption did not significantly distort the actual picture, since only 12 out of 154 countries changed their group during the period under review; two of them fluctuated around the border, and only six remained in the new group for more than two years. The characteristics of the initial data set are presented in Table 2.
Table 2. Descriptive Statistics of the Model Variables
|
Variable |
Average |
Standard deviation |
Lowest value |
Highest value |
|
GDP |
3.4 |
3.5 |
–36.4 |
25.2 |
|
LP |
46290.2 |
40976.8 |
1762.9 |
249867.8 |
|
DB |
62.3 |
12.8 |
29.4 |
88.7 |
|
CPI |
44.8 |
19.4 |
8.0 |
92.0 |
|
D |
0.5 |
0.2 |
0.0 |
0.9 |
The LP indicator was initially logarithmized (ln(LP)) to smooth over the excessive technological gap between countries. A similar order of other factors’ values allows one to use it in the framework of a single econometric model. Though wellbeing was not included in the number of the model’s regressors, the very division of countries into rich and poor allowed for implicitly taking it into account in the analysis of the calculation results.
Results of Empirical Calculations
With the notations described above, and after preliminary calculations the econometric dependence took the following form:
 (7)
(7)
Equation (7) takes into account the transition to panel data, which allowed for including, along with the country index i (6), the time index t; in parentheses the model constant comprises the components μi and λt: unobserved country–specific and temporal effects are measured with the corresponding dummy variables. Testing the CP for linear regression (7) requires compliance with the following conditions: α>0, β>0, γ>0, θ<0; the sign of the last parameter is inverted due to the traditional way of writing econometric models (7).
At the first stage of model calibration, the entire sample was tested to identify the most relevant panel data analysis technique. For all sample types, the standard F–test showed that the fixed effects model was preferable to the pooled regression. The Hausman Test confirmed the fixed effects model’s superiority over the random effects model. At the second stage, the Breusch–Godfrey test revealed heteroscedasticity in the model, which obliged us to use a robust to heteroscedasticity covariance–dispersion matrix in line with the Arellano method (HC0 type) (Arellano, 1987). Thus, all the constructed models are fixed effects ones and the explanatory variables’ coefficients were calculated using covariance–dispersion matrices.
Given the breakdown of countries into two groups, econometric models for each group and for the entire sample were built, on the basis of a single specification (7). Calculation results for countries which remained in the same income group are presented in Table. 3.
Table 3. Characteristics of Econometric Models for Countries that Remained in the Same Income Groups
|
Factors (coefficients) |
Entire country sample |
Rich countries |
Poor countries |
|
ln(LP) (γ) |
9.36** |
6.35* |
14.63** |
|
DB (β) |
0.11 |
0.43*** |
–0.32* |
|
CPI (α) |
0.04* |
0.07** |
–0.10 |
|
D (θ) |
–6.96 |
–14.22* |
9.17* |
|
Statistical characteristics |
|||
|
N |
1232 |
704 |
528 |
|
R2 |
0.05 |
0.13 |
0.08 |
|
F–test |
4.54*** |
6.33*** |
3.79*** |
|
Hausman Test |
67.06*** |
72.80*** |
39.50*** |
|
BG–test |
168.23*** |
102.69*** |
69.20*** |
Significance of regression coefficients: *** (0.01); ** (0.05); * (0.1).
Since some countries in the initial sample changed their income group during the period under review, it should be checked how significantly this affected the calculation results. For this purpose, model (7) was evaluated for countries whose income group changed; the calculation results are presented in Table 4.
Table 4. Characteristics of Econometric Models for Countries Whose Income Group Changed
|
Factors (coefficients) |
Entire country sample |
Rich countries |
Poor countries |
|
ln(LP) (γ) |
9.36** |
5.30* |
14.45*** |
|
DB (β) |
0.11 |
0.44*** |
–0.35*** |
|
CPI (α) |
0.04* |
0.07** |
–0.10 |
|
D (θ) |
–6.96 |
–15.01** |
10.77*** |
|
Statistical characteristics |
|||
|
N |
1232 |
708 |
524 |
|
R2 |
0.05 |
0.12 |
0.08 |
Significance of regression coefficients: *** (0.01); ** (0.05); * (0.1).
Comparing the results presented in Tables 3 and 4 shows invariance of the model calculations, while the discrepancies in the quantitative estimates turned out to be negligible. Therefore, the identified correlations can be seen as sufficiently objective and stable.
A fixed effects econometric model was built to set the model parameters, which has automatically eliminated the endogeneity problem. To make sure this issue was dealt with, calculations were carried out taking into account annual lag for all regressors, and for all regressors except the LP. The results turned out to be statistically unsatisfactory, which once again confirmed the initial hypothesis that the selected proxy variables were sufficiently dynamic to build a model even for relatively short time intervals.
The statistical characteristics of the model for the rich countries group confirm its adequacy. This conclusion indicates the non–random nature of the established correlations, especially taking into account the specifics of the constructed dependence where a highly dynamic and volatile output characteristic (GDP growth rate) is determined by cumulative conservative factors (technologies, institutions, culture). This confirms relevance of the chosen proxy variables for the three groups of factors under consideration. The use of different variable types (the output GDP characteristic is a flow (current annual value), while the regressors LP, DB, CPI, and D are stocks (accumulated over many years)) determines the low explanatory power of model (7). To increase the determination coefficient, control variables for fixed assets and employment should be introduced. However, this exceeds this paper’s goal which is testing the general CP hypothesis, not building an applied model for subsequent analytical calculations. In part, country and temporary dummy variables played the role of control variables.
As noted earlier, testing the CP involves obtaining significant regression coefficients with signs α>0, β>0, γ>0, θ<0. Based on this, the obtained results allow to draw the following conclusions.
Firstly, the calculations confirm the need to split the total country array into two income groups. Indeed, the initial heterogeneous sample yielded the correct signs for all regression coefficients, but the institutional factor and the CP turned out to be insignificant, which does not give grounds to see the CP as absolutely universal and unconditional. Its effect and strength depend on the country’s development level, which was the reason for introducing the two country groups.
Secondly, the CP holds true for rich countries but not for poor ones. If for the first group all model (7) coefficients pass the sign test and are significant, for the second group, three of the four regressors have an inverted sign, and one of them (culture) is not significant. Thus, the CP acts as an evolutionary mechanism, and becomes true as the country develops. Also, a kind of civilizational abyss lies between rich and poor countries. If in the former a mechanism for coordinating technological, cultural, and institutional achievements is at work, in the latter the said factors remain out of sync, and even contradict each other.
Thirdly, a common factor for all countries is production technology, which positively and sufficiently strongly affects economic growth. On the contrary, institutional, cultural, and CP–related factors divide rich and poor countries: in catching–up nations economic growth is more effectively supported by authoritarian government systems than by modern democratic institutions. The successful post–war development in Asian countries is a convincing confirmation of this conclusion.
Fourthly, institutions and culture act as fine–tuning tools, in rich countries in a positive way, and in poor ones negatively. In absolute terms the impact of these factor groups is insignificant and does not define economic growth.
Fifthly, in rich countries the main development driver is precisely the CP, as a mechanism integrating all aspects of social life, while poor countries mainly rely on technological advances. This once again reveals the fundamental difference in the development models of catching up and leading countries.
Discussion of the Results: the Wealth Factor
In the proposed econometric models, the wellbeing factor was taken into account by clustering countries into two groups. The wellbeing factor determines the dichotomy of the CP regime. To illustrate these differences, let us consider the data in Table 5.
Table 5. Critical Gross Per Capita National Income Values for Different Country Groups (thousand USD)
|
Year |
2012 |
2013 |
2014 |
2015 |
2016 |
2017 |
2018 |
2019 |
|
Upper bound of low–income countries |
1.0 |
1.0 |
1.0 |
1.0 |
1.0 |
1.0 |
1.0 |
1.0 |
|
Medium income |
4.1 |
4.1 |
4.1 |
4.0 |
3.9 |
3.9 |
3.9 |
4.0 |
|
Lower bound of high–income countries |
12.6 |
12.7 |
12.7 |
12.5 |
12.2 |
12.1 |
12.4 |
12.5 |
|
Russia, % of lower bound of high–income countries |
106.9 |
119.2 |
114.9 |
96.3 |
80.7 |
76.4 |
82.8 |
89.7 |
The lower bound of high–income countries is about 12 times higher than the upper bound of low–income countries, which indicates a wide gap due to the radically different modes of integrating the three factor groups: technological, institutional, and cultural ones. The above estimates are averages, while the gap in the extreme values is even more drastic. For example, in 2019 per capita income in Switzerland was 314.1 times higher than in Burundi. It is hardly surprising that countries divided by such a gap in wellbeing levels have completely different self–organization mechanisms, which is confirmed by the econometric models (Tables 3–4). In poor societies, the level of self–awareness, including that of the ruling elites, is extremely low, which makes maintaining an effective dialogue impossible. No public associations can be established in such environments, or people’s interests protected.
For countries where people are concerned with physical survival, the need to coordinate culture, institutions, and technologies is irrelevant. As the wellbeing increases, the public’s self–awareness and activity increase too, which pressures the ruling elites to regulate social life more efficiently. The CP may apply in poor countries also, but the econometric dependences in Tables 3–4 indicate that it can be quantified only in developed economies. The per capita income level which allows one to speak about the CP is by no means unreasonably high: more than half of the 154 studied countries fall into the rich group with a developed mechanism for coordinating culture, institutions, and technologies.
The CP allows to take a fresh look at the BRICS group of countries: Brazil, Russia, China, and South Africa can be classified as rich nations with fairly mature mechanisms for coordinating technological, institutional and cultural reproduction, while India stands out as a member of the poor countries group. Accordingly, it still lacks prerequisites for the CP to apply, which may slow down the country’s future development.
Another BRICS member, Russia, was subjected to international sanctions after 2014, the effectiveness of which has been repeatedly discussed in the literature (see, e.g., (Balatsky, 2018; Ekimova, 2018)). The CP allows for approaching this issue in a new way. Since in 2012–2019 Russia belonged in the rich countries group, after 2014 international sanctions did not push it into the poor nations’ one, where the positive integration mechanisms created by economic development are either extremely weak or do not work at all. The sanctions did not cause any fundamental damage to the Russian economy or interrupt the country’s development, since it already had sufficient groundwork to improve the institutions and increase political culture. At the same time, it must be noted that until 2014 inclusive Russia confidently remained in the high–income countries category, but in 2015 it has moved into the upper–middle income group where it stays to this day (Table 5). Thus, a certain loss in the former CP effectiveness can be noted.
The Discussion of the Results
Let us try to evaluate how the model calculation results match relevant theories. According to Acemoglu and Robinson’s narrow corridor concept (Acemoglu, Robinson, 2019), the key to the effectiveness of the modern state (Shackled Leviathan) is political balance between it and society. [8] Translated into the terminology applied in this paper, this is the interaction of two factor groups: institutions (state) and culture (society), which in reality remain inseparable and can only be distinguished notionally. At the same time their synthesis involves merging two functionally different phenomena: content (culture), and form (institutions). People’s attitudes, ideas, ideals, and behavioral models (culture) are contained in a kind of shell made of formal and informal behavior rules (institutions), which together set the cultural and institutional context in the country.
Acemoglu and Robinson’s concept assumes that the multitude of effective interactions between society and the state represented by the national elites form a “narrow corridor”, which can only be maintained if numerous conditions are met. If that is the case, institutions and culture synergistically reinforce each other, which in turn increases both the efficiency of the state and the opportunities for society. This process reproduces the evolutionary Red Queen effect which implies that society and elites need to make relentless efforts, to the limit of their abilities, to simply maintain the political status quo [9] (Acemoglu, Robinson, 2019). Otherwise, a conflict arises between the state and society, leading to the victory of either the first (despotism, or Despotic Leviathan) or the second (anarchy, or Absent Leviathan).
When elites and society are balanced, it promotes the emergence of progressive democratic institutions and increases the cultural level of the public, which allows them to support each other and achieve harmony. But if the society’s self–consciousness and aspirations for freedom are not particularly strong, the elites take advantage of this to establish and strengthen institutions for suppressing civil liberties (Despotic Leviathan). If elites’ self–consciousness, desire for order, and willingness to give up their privileges are insufficient, the risk of the state foundations’ destruction and the emergence of chaos (Absent Leviathan) increases.
The models presented in Tables 3–4 showed that a necessary condition for the emergence of the Red Queen effect, and shackling the Leviathan, is a high level of wellbeing typical for the group of rich countries with a relatively high per capita income. Of the 154 countries considered, only slightly more than half fall into the “narrow corridor” of per capita income sufficient to ensure political balance between the state and society. This conclusion not only agrees with the narrow corridor concept, but clarifies it. As noted earlier, a low standard of living forces people to concentrate on survival, relegating to the background the ideas of personal and political freedom, and even more so of taking control over the power structures.
We emphasize that countries with a high per capita income only meet a necessary condition for achieving the Red Queen effect, but by no means a sufficient one. Various rich countries have very different political institutions, for example, Saudi Arabia, Qatar, Brunei, Kuwait, the UAE, Bahrain, and Oman on the one hand, and the US, UK, France, Switzerland, and Sweden, on the other. All these nations have the economic prerequisites for achieving political equilibrium, but only in the second subgroup this equilibrium has actually been realized. Thus, in today’s world the CP applies more widely than the Red Queen effect and even acts as the first step toward achieving the latter. A sufficient condition for it is the CP holding true for the highest values of the proxy variables LP, DB, and CPI.
Discussion of Results: Structural Competition
The structural competition concept (Balatsky, 2021a) is based on the idea that the rate of social development depends on the efficiency of the market system. The latter includes four elements of competition: players (who competes), objects (for what and with what they compete), process (how they compete), and environment (where they compete), and the links between them. Players reflect the society’s culture, objects – production technologies, process – institutions, and environment – the ecosystem and geographical factor.
The structural market system elements are consolidated and coordinated through market self–regulation, a higher level of which increases the efficiency of the entire social system and accelerates economic growth. Structural self–assembly of the market system is expressed through the CP, while its specific mechanisms make up the functional core of the system (Figure 1). The process of self– and re–configuration of the system is triggered by external perturbations – challenges (Toynbee, 1966) or stressors (Taleb, 2007). Its (the system’s) further existence depends on how successful the society’s organizational response will be.

Figure 1. Market Competition Structure
[External environment; Culture; Competition player; Geography; Competition environment; CP (system’s assembly); Competition object; Technology; Competition process; Institutions; Challenge; Response]
The scheme in Figure 1 is sufficiently abstract to be interpreted at different levels: corporate, social, national, regional, and even global ones. In its current form it raises several questions. First, does the CP have the symmetrical property, when the improvement in different factor groups has a unidirectional effect on the economic growth rate? Second, what is the CP’s role in the competitive mechanism? An equation describing GDP growth rate sensitivity to changes in the CPI can provide an answer to the first question:
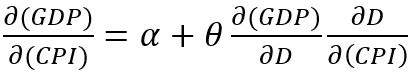 (8)
(8)
Similar equations can be applied to the other two factor groups. And, as can be seen from equation (8), in addition to the direct impact, due to the CP the macro–factor has a certain indirect effect associated with GDP’s increased sensitivity to the imbalance between the macro–factor D (∂(GDP)/∂D) and the perturbation of the D imbalance by the CPI (∂D/∂(CPI)). In model (8) both of these components depend on the initial conditions, i.e., a specific country and point in time. In the end the overall impact of the three factor groups (technology, culture, and institutions) can be unidirectional or multi–vector. To be more precise, let us consider the 2019 situation in the four most indicative countries: the US, Germany, China, and Russia, which serves as a base scenario and a starting point for applied calculations. In parallel, we shall consider three scenarios in each of which one macro–factor changes by 10 percentage points, while the others remain unchanged. The calculation results are presented in Table 6.
Table 6. Different Factor Froups’ Impact on the Economic Growth Rate
|
Country |
Scenario |
D, % |
∆D, p.p. |
∆GDP, % |
|
US |
Base |
43.6 |
– |
– |
|
∆[ln(LP)] |
36.2 |
–7.4 |
1.7 |
|
|
∆(DB) |
56.3 |
12.7 |
–1.8 |
|
|
∆(CPI) |
50.2 |
6.6 |
–0.9 |
|
|
Germany |
Base |
57.9 |
– |
– |
|
∆[ln(LP)] |
44.6 |
–13.3 |
2.5 |
|
|
∆(DB) |
64.6 |
6.7 |
–0.9 |
|
|
∆(CPI) |
64.6 |
6.7 |
–0.9 |
|
|
China |
Base |
66.6 |
– |
– |
|
∆[ln(LP)] |
59.9 |
–6.7 |
1.6 |
|
|
∆(DB) |
79.9 |
13.3 |
–1.8 |
|
|
∆(CPI) |
68.1 |
1.5 |
–0.2 |
|
|
Russia |
Base |
77.5 |
– |
– |
|
∆[ln(LP)] |
70.9 |
–6.6 |
1.6 |
|
|
∆(DB) |
90.7 |
13.2 |
–1.8 |
|
|
∆(CPI) |
70.8 |
–6.7 |
1.0 |
As shown in Table 6, in 2019 among the countries under consideration, the three groups of factors were most highly balanced in the United States and were most poorly balanced in Russia. The imbalance of macro–factors in Russia was 1.8 times higher than in the US, which in itself indicates a large socioeconomic gap between the two countries. Under these circumstances the CP effect becomes fundamentally asymmetric: an improvement in production technologies in all cases has a positive effect on economic growth, while an increase in the DB and CPI values leads to an imbalance of the three factor groups and hinders growth (the only exception is Russia, which is clearly lagging behind in terms of the CPI, so its growth improves the overall situation). The CP symmetry is individual in nature, and by default absent.
The answer to the second question follows from equation (7) itself, according to which each factor group’s impact is expressed directly and indirectly as shown in equation (8). Thus, the coefficient D (which reflects the CP effect) acts as a kind of competitive feedback mechanism: if market processes become one–sided and manifest in a single area only (e.g., technology), the imbalance of D begins to increase and absorbs some of the direct positive effect of this unilateral progress. Here the CP plays the role of a natural regulator of competitive processes taking place in various areas, signalling to the system that the potential of a factor group which has got ahead of others is exhausted. The ability of the state to influence each of these groups allows it to both strengthen and weaken the CP’s regulatory function.
Discussion of Results: Chaos and Complexity
In recent years applying the self–organization theory to social problems became increasingly popular. The self–organiation of society in interacting with state institutions was addressed in (Nederhand et al., 2016; Edelenbos et al., 2018). The role of self–organization in the emergence of the post–capitalist culture is explored in (Escobar, 2017). The importance of this line of thought suggests the CP should be considered in terms of the chaos and complex systems theories.
The self–organization theory implies that a stable structure underlies the apparent disorder and nonlinearity of processes (Mann, 1992). Similarly, the CP views the market system as a self–ordering one, consolidating its structural elements through competition. At first glance, competition generates a multitude of multidirectional market interactions. However, on a historical scale these interactions’ cumulative experience changes (a) the market players themselves (culture), (b) the rules of their interaction (institutions), (c) the means of competing (technologies), and (d) the very market ecosystem (geography). It is these processes which, unfolding simultaneously, create the social fabric. Depending on the effectiveness of the competition mechanism, more and less highly developed state structures emerge.
An important aspect of the above reasoning is the non–linear nature of competition’s effect on social development. A lack of it does not allow individuals’ creative potential to fully come out, while its excess hinders the implementation of creative ideas; therefore, an effective competition mechanism implies finding a competitive regime optimal for the market. Spontaneous competition leads to anarchy, or, in Acemoglu and Robinson’s terms, to Absent Leviathan; artificially suppressed competition gives rise to a clumsy government system inefficiently administering the economy, or Despotic Leviathan. An effective state with a large innovation potential – Shackled Leviathan – achieves the right balance between centralized public administration and market self–regulation externally manifested through the CP. Thus, the impact of competition on economic growth is non–linear, since there can be too much and too little competition. Therefore, it is important not only to nurture competitive forces but also control them, which is largely the prerogative of the state.
Perhaps the most striking example of excessive competition and the chaos it creates is the Federal Republic of Somalia, where since the early 1990s famine, civil wars and armed gang activity rage. An example of a lack of market competition is the present–day Russian Federation where big business operates in the form of monopolistic state–owned corporations, while the success of small and medium–sized enterprises depends more on their administrative competition potential and government connections than on production or technological performance. In both these cases the social system’s sensitivity to innovation turned out to be low.
In the framework of the chaos and complexity theories, the role of CP seems to be quite obvious. In the early social development stages, the initial chaos is ordered by one specific dominant force, namely the geographical factor which forces people to actively explore the surrounding landscape. This period can be associated with such multidirectional events as wars, construction of irrigation facilities, internal strife, technological innovation, unification and separation of large social structures, natural disasters, epidemics, etc. At a certain stage a disorganized set of events is structured into distinct social subsystems: legal (institutions), behavioral (culture), and production (technology) ones. As they grow more complex, their importance for society and the role in making certain decisions increase. Thus, out of the primitive social chaos a (mainly) state–like order crystallizes. The subsequent development of the cultural, institutional, and technological subsystems turns the CP into a mechanism for synchronizing this development, ensuring social harmony and balance and multidirectional competition. The CP acts as a kind of anti–entropic gravitational force which does not allow the three key social subsystems to ynchronizes. Furthermore, it creates a synergy from the subtle integration of these subsystems, measured using equation (7) of the factor D. At mature social development stages, the CP acts as its self–regulation mechanism, including conscious self–regulation by the state and elites, creating and adjusting a kind of friction between various social system elements.
It is quite difficult to trace the CP’s role in the emergence and historical development of society, but it becomes sufficiently obvious during the periods of civilisations’ decline and fall. For example, the high level of culture in ancient India or China was not supported by adequate institutional and technological systems, which has led to their relative lagging behind the European civilization. Ancient Rome, on the contrary, with its quite perfect legal system and advanced technologies, fell into decay due to the gradual destruction of its traditional culture.
Conclusion
The diversification of social evolution theories has led to the emergence of polycausal concepts which refuse to single out one leading development factor, and consider them all as relatively equal. One such approach is the structural competition concept (Balatsky, 2021a), in which the CP plays a key role. The calculations presented above allowed for empirically verifying this principle, highlighting a structural pattern in a group of 88 relatively rich countries where economic growth rates positively depend on the balance in the development of three factor groups – cultural, institutional, and technological ones. Thus, an analytical confirmation of the structural competition concept and the CP was found. In other countries the CP may also apply, albeit in a slightly different form, so the proxy variables used here cannot measure it.
The established structural pattern highlights the issue of countries’ and peoples’ social evolution from a new angle: the progress must move on along a broad front, covering all aspects of social life. This requirement implies an extremely high plasticity of the social system which is capable of responding to external perturbations in time by aligning some groups of factors with others. For example, the technological modernization of the economy must be accompanied by sweeping institutional and cultural reforms. However, since each country has its own civilizational characteristics, there can be no ready–made recipes for accelerating its development. Apparently, this explains the numerous failures of progressive reforms in many countries of the world.
References
Acemoglu D., Robinson J. (2012) Why Nations Fail: The Origins of Power, Prosperity, and Poverty, New York: Random House.
Acemoglu D., Robinson J. (2019) The Narrow Corridor, New York: Random House.
Acs Z.J., Anselin L., Varga A. (2002) Patents and innovation counts as measures of regional production of new knowledge. Research Policy, 31(7), 1069–1085. DOI: 10.1016/s0048–7333(01)00184–6
Agyei–Mensah B.K., Buertey S. (2019) The effect of corruption and culture on corporate social performance: An empirical study. Social Responsibility Journal, 15(8), 1071–1086. DOI: 10.1108/srj–12–2017–0271
Arellano M. (1987) Computing robust standard errors for within–groups estimators. Oxford Bulletin of Economics and Statistics, 49(4), 431–434.
Balatsky E.V. (2018) Damage to Russia from International Sanctions: Rethinking the Facts. The World of the New Economy, 12 (3), 36–45. DOI: 10.26794/2220–6469–2018–12–3–36–45 (in Russ.).
Balatsky E.V. (2021a) Polycausal concept of social evolution. Economic and Social changes: Facts, Trends, Forecast, 14 (6), 49–69. DOI: 10.15838/esc.2021.6.78.3 (in Russ.).2022 Vol. 16 No 3 FORESIGHT AND STI GOVERNANCE 47
Balatsky E.V. (2021b). The principle of consistency in the theory of social development. Terra Economicus, 19 (1), 36–52. DOI: 10.18522/2073–6606–2021–19–1–36–52 (in Russ.).
Balatsky E.V., Pliskevich N.M. (2017). Economic Growth Under Extractive Institutions: The Soviet Paradox and Contemporary Events. Universe of Russia, 4, 97–117. DOI: 10.17323 / 1811–038X–2017–26–4–97–117 (in Russ.).
Barr A., Serra D. (2010) Corruption and culture: An experimental analysis. Journal of Public Economics, 94(11–12), 862–869. DOI: 10.1016/j.jpubeco.2010.07.006
Cvetanović S., Mitrović U., Jurakić M. (2019) Institutions as the Driver of Economic Growth in Classic, Neoclasic and Endogenous Theory. Economic Themes, 57(1), 111–125. DOI: 10.2478/ethemes–2019–0007
Diamond J. (1997) Guns, Germs, and Steel: The Fates of Human Societies, New York: W.W. Norton.
Dridi M. (2013) Corruption and Economic Growth: The Transmission Channels. Journal of Business Studies Quarterly, 4(4), 2152–1034.
Edelenbos J., Van Meerkerk I., Schenk T. (2018) The evolution of community self–organisation in interaction with government institutions: Cross–case insights from three countries. The American Review of Public Administration, 48(1), 52–66. DOI: 10.1177/0275074016651142
Ekimova N.A. (2018) International Sanctions Against Russia: Implicit Benefits. The World of the New Economy, 19 (4), 82–92. DOI: 10.26794/2220–6469–2018–12–4–82–92 (in Russ.).
Escobar A. (2017) Other worlds are (already) possible: Self–organisation, complexity and post–capitalist cultures. In: Social Movements (eds. S. Savyasaachi, R. Kumar), London: Routledge, pp. 297–311. DOI: 10.4324/9781315662084–18
Fagerberg J. (2000) Technological progress, structural change and productivity growth: A comparative study. Structural Change and Economic Dynamics, 11(4), 393–411. DOI: 10.1016/s0954–349x(00)00025–4
Freinkman L.M., Dashkeev V.V., Muftyakhetdinova M.R. (2009) Analysis of institutional dynamics in countries with economies in transition, Мoscow: IEP (in Russ.).
Fukuyama F. (1995) Trust: The social virtues and the creation of prosperity, New York: The Free Press.
Giordano C., Toniolo G., Zollino F. (2017) Long–run trends in Italian productivity (Occasional Paper 406), Rome: Bank of Italia. DOI: 10.2139/ssrn.3082193
Góes C. (2016) Institutions and growth: A GMM/IV panel VAR approach. Economics Letters, 138, 85–91. DOI: 10.1016/j.econlet.2015.11.024
Granato J., Inglehart R., Leblang D. (1996) The effect of cultural values on economic development: theory, hypotheses, and some empirical tests. American Journal of Political Science, 40(3), 607–631. DOI: 10.2307/2111786
Guiso L., Sapienza P., Zingales L. (2006) Does Culture Affect Economic Outcomes? Journal of Economic Perspectives, 20(2), 23–48. DOI: 10.1257/jep.20.2.23
Gumilev L. (2016) Ethnogenesis and the Earth’s biosphere, Moscow: Iris–Press (in Russ.).
Haidar J.I. (2012). The impact of business regulatory reforms on economic growth. Journal of the Japanese and International Economies, 26(3), 285–307. DOI: 10.1016/j.jjie.2012.05.004
Hauk E., Saez–Marti M. (2002) On the cultural transmission of corruption. Journal of Economic Theory, 107(2), 311–335. DOI: 10.1006/jeth.2001.2956
Husted B.W. (1999) Wealth, culture, and corruption. Journal of International Business Studies, 30(2), 339–359.
Karimzadi Sh. (2019) Culture in Economics. Advances in Economics and Business, 7(1), 39–54. DOI: 10.13189/aeb.2019.070105
Kirdina–Chandler S.G. (2018) Western and non–Western institutional models in time and space. Theoretical Economics, 1, 73–88. DOI: 10.24411/2587–7666–2018–00005 (in Russ.).
Lal D. (1998) Unintended Consequences. The Impact of Factor Endowments, Culture, and Politics on Long–Run Economic Performance, Cambridge, MA: MIT Press.
Mann S.M. (1992) Chaos Theory and Strategic Thought, Parameters (September), 54–68.
Marini A. (2016) Cultural beliefs, values and economics: A survey (MPRA Paper 69747). https://ideas.repec.org/p/pra/mprapa/69747.html, accessed 27.05.2022.
Marini M. (2004) Cultural evolution and economic growth: A theoretical hypothesis with some empirical evidence. The Journal of Socio–Economics, 33(6), 765–784. DOI: 10.1016/j.socec.2004.09.044
Marx K., Engels F. (1960) Essays (vol. 23), Moscow: State Publishing House of Political Literature (in Russ.).
Masella P., Paule–Paludkiewicz H., Fuchs–Schündeln N. (2019) Cultural Determinants of Household Saving Behavior. Journal of Money, Credit and Banking, 52(5), 1035–1070. DOI: 10.1111/jmcb.12659
Mathers R.L., Williamson C.R. (2011) Cultural context: Explaining the productivity of capitalism. Kyklos, 64(2), 231–252. DOI: 10.1111/j.1467–6435.2011.00504.x
Messaoud B., Teheni Z.E.G. (2014) Business regulations and economic growth: What can be explained? International Strategic Management Review, 2(2), 69–78. DOI: 10.1016/j.ism.2014.03.001
Mo P.H. (2001) Corruption and economic growth. Journal of Comparative Economics, 29(1), 66–79. DOI: 10.1006/jcec.2000.1703
Mornah D., Macdermott R.J. (2018) A Non‐Proxied Empirical Investigation of Cultures Effect on Corruption. Business and Society Review, 123(2), 269–301. DOI: 10.1111/basr.12142
Nawaz S. (2015) Growth effects of institutions: A disaggregated analysis. Economic Modelling, 45, 118–126. DOI: 10.1016/j. econmod.2014.11.017
Nederhand J., Bekkers V., Voorberg W. (2016) Self–Organisation and the Role of Government: How and Why Does Self–Organisation Evolve in the Shadow of Hierarchy? Public Management Review, 18(7), 1063–1084. DOI: 10.1080/14719037.2015.1066417
North D.C. (1991) Institutions. Journal of Economic Perspectives, 5(1), 97–112. https://www.jstor.org/stable/1942704
North D.C. (2010) Understanding the Process of Economic Change, Princeton, NJ: Princeton University Press.
North D.C., Wallis J.J., Weingast B.R. (2009) Violence and Social Orders. A Conceptual Framework for Interpreting Recorded Human History, Cambridge: Cambridge University Press.
Ostapenko N. (2015) National culture, institutions and economic growth: The way of influence on productivity of entrepreneurship. Journal of Entrepreneurship and Public Policy, 4(3), 331–351. DOI: 10.1108/jepp–11–2014–0040
Petrakis P.E. (2014) Culture, growth and economic policy, Heidelberg, Dordrecht, London, New York: Springer.
Polterovich V.M. (2002) Political Culture and Transformational Decline. Commentary on Arye Hillman’s article “On the Road to the Promised Land”. Ekonomika i matematicheskie metody, 38 (4), 95–103 (in Russ.).
Polterovich V.M. (2016a) Institutions of catch–up development (to the draft of a new model of economic development in Russia). Economic and Social Changes: Facts, Trends, Forecast, 5, 88–107. DOI: 10.15838/esc/2016.5.47.2 (in Russ.).
Polterovich V.M. (2016b) Positive cooperation: Factors and mechanisms of evolution. Voprosy Ekonomiki, 11, 1–19. DOI: 10.32609/0042–8736–2016–11–5–23 (in Russ.).
Polterovich V.M. (2018a) Towards a general theory of socio–economic development. Part 1. Geography, institutions or culture? Voprosy Ekonomiki, 11, 1–22. DOI: 10.32609/0042–8736–2018–11–5–26 (in Russ.).
Polterovich V.M. (2018b) Towards a general theory of socio–economic development. Part 2. Evolution of coordination mechanisms. Voprosy Ekonomiki, 12, 77–102. DOI: 10.32609/0042–8736–2018–12–77–102 (in Russ.).
Ramocka M. (2010) Culture as an economic growth factor. Zeszyty Naukowe Małopolskiej Wyższej Szkoły Ekonomicznej w Tarnowie, 2(16), 117–123.
Reati A. (2001) Total factor productivity–a misleading concept. BNL Quarterly Review, 54(218), 313–332.
Rodrik D. (ed.) (2003) In Search of Prosperity: Analytic Country Studies on Growth (ed. D. Rodrik), Princeton, NJ: Princeton University Press.
Sandholtz W., Taagepera R. (2005) Corruption, culture, and communism. International Review of Sociology, 15(1), 109–131. DOI: 10.1080/03906700500038678
Sargent T.C., Rodriguez E. (2000) Labour or Total Factor Productivity: Do We Need to Choose? International Productivity Monitor, 1, 41–44.
Solow R.M. (1956) A contribution to the theory of economic growth. The Quarterly Journal of Economics, 70(1), 65–94. https:// www.jstor.org/stable/23606794
Solow R.M. (1957) Technical change and the aggregate production function. The Review of Economics and Statistics, 39(3), 312–320. DOI: 10.2307/1926047
Tabellini G. (2010) Culture and institutions: Economic development in the regions of Europe. Journal of the European Economic Association, 8(4), 677–716. DOI: 10.1111/j.1542–4774.2010.tb00537.x
Taleb N. (2007) The Black Swan: The Impact of the Highly Improbable, New York: Random House.
Toynbee A.J. (1966) Change and Habit: The Challenge of Our Time, Oxford: Oxford University Press.
Tvaronavičienė M., Grybaitė V. (2012) Sustainable development and performance of institutions: Approaches towards measurement. Journal of Security and Sustainability Issues, 1(3), 167–175.
Urbano D., Aparicio S., Audretsch D. (2019) Twenty–five years of research on institutions, entrepreneurship, and economic growth: What has been learned? Small Business Economics, 53(1), 21–49. DOI: 10.1007/s11187–018–0038–0
Van Beveren I. (2012) Total factor productivity estimation: A practical review. Journal of Economic Surveys, 26(1), 98–128. DOI: 10.1111/j.1467–6419.2010.00631.x
Van Der Borg J., Russo A.P. (2005) The Impacts of Culture on the Economic Development of Cities. European Institute for Comparative Urban Research, Rotterdam: Erasmus University.
Vanino E., Lee S. (2018) Extractive institutions in non–tradeable industries. Economics Letters, 170, 10–13. DOI: 10.1016/j. econlet.2018.05.025
Weber M. (1930) The Protestant Ethic and the Spirit of Capitalism, London, Boston: Unwin Hyman.
Welzel C. (2013) Freedom Rising, Cambridge: Cambridge University Press.
[1] Marx's productive forces mean not only technologies (labour tools), but also workers with their knowledge and experience. However, growth of productive forces is driven specifically by development of technology (production capital).
[2] https://data.worldbank.org/indicator/NY.GDP.MKTP.KD.ZG, accessed on 21.11.2021.
[3] https://www.ilo.org/shinyapps/bulkexplorer30/?lang=en&segment=indicator&id=GDP_211P_NOC_NB_A, accessed on 21.11.2021.
[4] https://russian.doingbusiness.org/ru/data, accessed on 21.11.2021.
[5] https://www.transparency.org/en/cpi/2020/index/nzl, accessed on 21.11.2021.
[6] https://www.transparency.org/files/content/pressrelease/2012_CPITechnicalMethodologyNote_EMBARGO_EN.pdf, accessed on 21.11.2021.
[7] https://datatopics.worldbank.org/world–development–indicators/the–world–by–income–and–region.html#:~:text=The World Bank classifies economies,-middle, and high income, accessed on 21.11.2021.
[8] “Narrow corridor” is graphically represented by coordinates on the “strength of society” and “strength of state” plane, reflecting the position of these two actors. There is a “narrow corridor” on the graph around the bisector, denoting the zone where the strength of the state and society is approximately equal..
[9] In Russian–language literature the “Red Queen effect” is called the “Black Queen effect”; we retain the authors’ version.
Official link to the article:
Balatsky E., Yurevich M. Consistency Principle: Theory and Empirical Evidence // «Foresight and STI Governance», 2022. Vol. 16, No. 3, P. 35–48.