
In terms of technological development level, countries can be divided into leaders (the core) and followers (the periphery and semi–periphery). To reduce the technological lag, a mix of new technology development (innovation) or borrowing (imitation) strategies can be used, in various proportions. Despite the seeming “simplicity” of the imitation approach, only a few of the countries that opted for this model managed to come closer to the leaders.
Many factors hinder the implementation of an effective innovation policy. One of them is the difficulty of defining the technological frontier (TF) – a critical point (reflecting relative labor productivity compared with a leader country) beyond which it would make sense to move on from borrowing foreign technologies to developing domestic ones. Underestimating this factor leads to a situation where, if the country’s development level has exceeded the TF but the national strategy remains focused on technology borrowing, the economy falls into a trap and further progress is hindered [Dementyev, 2006]. And vice versa, trying to implement major research and development (R&D) projects while the national economy remains significantly below the TF leads to pointless expenditures due to the lack of demand for advanced production technologies.
The goal of this paper is to develop an algorithm for identifying the TF on the basis of international statistics. Taking this parameter into account provides significant advantages, since it allows one to determine the moment for switching from an imitation to innovation strategy in a timely manner.
The Technological Frontier Concept
In the economic literature, the TF concept emerged in the framework of endogenous economic growth theories. It is closely related to the concept of aggregate or total factor productivity (TFP). This term (occasionally the term “Solow residual” is used in its stead) implies estimating the technological progress in an economy as the difference in the weighted growth rates of output and other production factors [Solow, 1956]. In the canonical models, the latter include labor and physical capital, while more sophisticated variations add human resources, quality of institutions, infrastructure, and so on. The classical Solow model comprises prerequisites such as a constant economy of scale, perfect competition conditions, and companies operating at the limit of their production capabilities.
Various “frontier–based” methods to assess technological progress have been proposed to eliminate these factors: non-parametric envelope methods (linear programming) [Farrell, 1957] and stochastic production frontier models (panel data) [Aigner et al., 1977]. Both these approaches are focused on assessing technological progress on the basis of modeling the production frontier by identifying the highest productivity of the technological factor. In a number of studies, the frontier is called “technological” [Caselli et al., 2006]. However, this understanding of TF implies taking into account the technological capabilities of the economy, i.e., it involves an extended connotation of the concept in question. Such an interpretation is rather complicated, since it requires one to consider a set of the most efficient production methods available under certain conditions (for a company, industry, or country) [Sato, 1974]. Furthermore, in English this concept has a double meaning. “Frontier” technology means a technology that can radically transform the established economic or social processes. These include, for example, renewable energy, artificial intelligence, electric vehicles, etc. [UNCTAD, 2018]. The totality of such technologies available on the market define the technology frontier as a limit of technological capabilities.
The extended interpretation of TF identifies it with the technological factor in the broadest sense of the word, while in natural sciences and engineering TF has a narrower meaning: it is a threshold value (e.g. temperature) at which the observed object or process fundamentally change their properties (e.g. melting temperature). This understanding is increasingly used by economists who model companies’ or countries’ behavior when they move on from investing in buying foreign technologies (imitation) to conducting their own R&D (innovation).
Attempts to model organizations’ behavior when they change their investment mode have been made since the 1960s [Scherer, 1967; Baldwin, Childs, 1969]. Initially the cost–based approach was used: expenditures on procuring technology (imitation) were seen as advantageous due to their quick payback time. However, as the company loses its market share, the profits generated by applying the newly acquired technology rapidly diminish. On the other hand, the costs associated with in–house development are less attractive in the short term, but in the longer run they turn out to be more than justified. Thus, taking into account the market specifics, companies always face a choice: imitate innovations or create them.
This approach looks promising but becomes more complicated due to the need to assess alternative effects over time. Subsequently it was applied at the macro–level. A model has been developed which considers the industry as a competitive arena for innovator and imitator companies and describes the impact of corporate strategies on economic growth and the effectiveness of government R&D subsidies [Segerstrom, 1991]. Still later, dividing countries into technological leaders and followers allowed for identifying policies that helped each group achieve the highest growth rate [Sala–i–Martin, Barro, 1995]. A dichotomy was introduced for the technological regime not just of companies (countries), but also numerous other market players, which became the basis for subsequent empirical research. Though the term TF was not directly mentioned in these publications, they prepared the ground for its new understanding.
A simple rule was formulated: disruptive innovations (i.e. reaching the TF) become profitable when the return on technological advances increases and the scale of innovation exceeds the R&D costs [Paulson Gjerde et al., 2002]. Initially this rule was applied to individual companies, but it can be easily applied to industries and countries. A basic pattern was revealed: less developed economies tend to choose the imitation path, while more advanced ones adopt innovation strategies. The distance to the global TF is a measure of the economy’s maturity [Acemoglu et al., 2003, 2006]. Obviously, the mode switching occurs relatively smoothly when both methods of technological development can coexist. The closer a country gets to the TF, the more complex the technologies it borrows become, while the importance of domestic innovations based on human capital and national S&T groundwork increases [Acemoglu, 1997]. Innovations emerge in industries (economies) which belong in the “frontier” zone or are close to it; the need for technology borrowing increases the farther the national economy is from the global TF level [Cincera, van Pottelsberghe, 2001; Polterovich, 2009]. Thus, the idea of a mixed strategy was suggested, when borrowing new technologies and developing them take place at the same time, and the growth is evident in increased innovation activity.
In general, the extended interpretation of TF is due to the accelerated pace of technological change itself. For example, commercialization of one of the “frontier” technologies can significantly shift the TF the world over. There is a fundamental difference between innovation “for oneself”, implemented by, among other things, borrowing technologies, and a real innovation for the market. Sales of the latter mean recognition by consumers, which to a certain extent “pushes” the TF [Yasin, Snegovaya, 2018]. Therefore, the extended interpretation of TF is more abstract and more difficult to verify, while it meaningfully explains companies’ and countries’ development paths and serves as an element in the system applied to plan further progress.
TF Quantification Practices
Let us consider certain approaches to identifying the TF.
1. Defining TF as TFP in traditional production functions [Bessonova, 2007]: 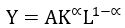 ,
,
Where Y is total output; K is capital; L is labor; α is elasticity; A is total factor productivity interpreted as TF.
The authors would like to remind the reader that more complex and realistic modifications are developed by introducing additional factors or disaggregating the basic components (e.g. breaking labor down into skilled and unskilled) [Caselli et al., 2006]. The main advantage of this approach is the possibility of introducing two TF types: 1) the distance between the country and its notional limit, i.e., the maximum attainable productivity, and 2) the distance between the country’s notional limit and the global TF [Filippetti, Peyrache, 2017]. The second approach has proven its usefulness in explaining the economic growth rate taking into account the country’s technological lag [Battisti et al., 2018; Rabe, 2016]. It focuses on the economy’s abstract marginal technological potential expressed in dimensionless units.
2. Defining TF as the ratio of labor productivity in the economy under consideration to that in a leading country (typically the US) taking into account purchasing power parity [Aghion et al., 2005] allows one to see this value as a dividing line between the imitation and innovation behavior modes. The TF value is often introduced into equations containing other macroeconomic variables such as value added, R&D expenditures, intermediate products costs, etc. A similar scheme is applied at the micro–level, with the only difference being that one or several competing companies are introduced into the equation system to calculate profit margins associated with choosing the innovation mode, while the TF turns out to be equal to the highest productivity among all companies [Benhabib et al., 2017]. Thus, in these studies the very TF concept is essentially replaced by the relative labor productivity indicator. As a result, the distance to the technological leader is taken into account, but strictly speaking, the point of switching from borrowing innovations to creating them is not identified.
Whereas the country– or industry–level empirical data is usually collected by national statistical offices, sociological studies are conducted to estimate the TFs for individual companies. For example, a survey of Spanish businesses allowed for modeling the impact of companies’ technological gap with the leading firm on their choice between innovation creation and borrowing; the TF was measured as the TFP [Gombau, Segarra, 2011]. A similar survey was conducted in African countries, but TF was not considered in the context of imitation vs innovation [Cirera et al., 2017]. Case studies of Portuguese enterprises revealed the impact of structural reforms on changing the distance from the TF [Gouveia et al., 2017]. There is a study assessing the efficiency of R&D expenditures depending on the proximity to the TF based on a survey of about 550 companies with the highest R&D expenditures in the world [Andrade et al., 2018]. The above indicates that a not very transparent construct (i.e. relative TFP) was applied as TF here too. Plus, measuring the TF is relatively simple: the calculations again boil down to calculating the gap between the maximum (frontier) and actual TFP value for numerous market participants.
3. Identifying the TF on the basis of qualitative company surveys. This approach is based on a closed–ended question (with multiple answer options to choose from) about the estimated level of technologies applied by the company (more advanced compared to competitors, about the same, or inferior) [Alder, 2010]. In particular, it was used in the 2002-2008 World Bank study covering more than 9,000 enterprises. [1] Another variant of the question was used in a survey of Korean companies: “What is the purpose of applying innovations?” The provided answer options allowed one to classify the respondents’ technological strategies: opening new markets (companies at the TF level), increasing market share or diversifying product line (followers), or changing product design (outsiders) [No, Seo, 2014]. The weakness of this approach is due to the fact that surveys are conducted rarely, their results are not internationally comparable, and companies are grouped using non–representative samples.
4. Indirect assessment of the TF based on Tobin’s Q ratio (the ratio of the company assets’ market value to their replacement value) [Coad, 2008]. Up–to–date stock market data allows for identifying changes in companies’ behavior patterns depending on their performance. However, an increase in Tobin’s Q ratio is not always caused by the firm’s increased technological level.
Thus, each of the “digitization” methods described in the international literature has its strengths and weaknesses depending on the context of the analysis. In Russia the term “technological frontier” is applied purely descriptively; no examples of its quantitative interpretation, and therefore inclusion in macroeconomic models, have been found. In the scope of the most promising approach to understanding TF, a theory of the shift from borrowing new technologies to developing them has been proposed [Polterovich, Tonis, 2005]. TF was interpreted as the relative labor productivity (compared with the US), exceeding which makes the country’s own R&D products economically viable. Two econometric relationships were identified, describing the costs of imitation and innovation, which in our previous work [Balatsky, 2012] were used to directly calculate the TF. The fundamental possibility of a simple analytical solution to a similar problem was demonstrated. To the best of our knowledge, no other attempts to quantify TF (according to the modern understanding as the point of shifting from one behavior mode to another) were made in Russia. At the same time, the initial data in the aforementioned study was of a very generalized nature and required substantial refinements. Thus, the TF problem by its very nature implies the need for more subtle methodological approaches. For example, the question about how universal TF is, spatially and temporally, remains open. In particular it is unclear how much the TF differs across groups of nations at different economic development levels and in which direction it drifts over time. The subsequent constructs are intended to answer these questions.
A Theoretical Innovation Market Model
Continuing the logic presented in [Polterovich, Tonis, 2005; Balatsky, 2012], we will consider two sides of the innovation market. There are two possible interpretations of market interactions: at the micro– (costs), and macro–economic (market) levels. The micro–level was addressed in the aforementioned studies and is more traditional.
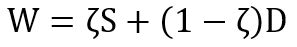
Let S be the country’s unit costs of buying on the open technology market (royalty balance) and D its R&D expenditures. The main assumption is that these costs are functions of labor productivity P. It would be reasonable to believe that as the country’s technological level increases (relative labor productivity, typically compared to the notional leader, the US), its unit R&D costs decrease, while productivity growth leads to increased expenditures on technology borrowing due to the need to buy ever more advanced and expensive technologies. In this case, the choice of national innovation strategy can be described by a generalised function of unit costs W which combines the two types of expenditures with the weight coefficient ζ:
 (1)
(1)
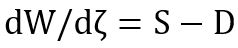
Optimizing combination (1) by the weight coefficient results in the simplest condition:
 (2)
(2)
Thus, the optimum is achieved when the two–unit cost types are equal. A rational national strategy does not imply choosing the right proportion between these two types of costs and implementing a mixed approach. On the contrary, it entails following a simple rule: if D>S, then dW/dζ<0, and the country mainly uses its own R&D products. Otherwise, the strategy to follow is massive technology borrowing. In practice a mixed strategy is usually applied, with the clear dominance of one cost type. For us, the abovementioned moment when one of the “pure” innovation strategies prevails is important.
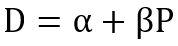
For simplicity, along with many previous studies we will assume that cost dependencies are described by the simplest linear labor productivity functions:
 (3)
(3)
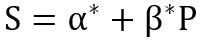 (4)
(4)
where α, α*, β and β* are parameters.
Then the equilibrium labor productivity value P* with S=D becomes the desired TF:
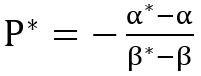 (5)
(5)
According to the second interpretation (the market or macro–economic one), equation (3) describes the demand for technological know–how, while equation (4) describes the supply of technological innovations. Here it would be reasonable to assume that demand (the economy’s need for innovations) decreases with the growth of labor productivity, while the supply (the ability to generate royalties) increases. Then equilibrium on the royalty market is achieved when supply and demand are equal, which determines the TF (5).
Despite its relative simplicity, the proposed innovation market model yields meaningful and verifiable results. Let us consider the possibility of its econometric verification, for which it is sufficient to construct regressions of equations (3) and (4).
Methodology of the Study
Initial data
The applied calculations to identify the TF are based on statistical data from the World Development Indicators database [2] for 1996-2017 (22 observations). The following variables were used:
- P is the relative labor productivity (GDP per worker employed in the economy) [3];
- D is internal R&D expenditures as a share of GDP (proxy variable for innovation unit costs);
- C is fixed capital investments as a share of GDP (gross fixed capital formation);
- S is the ratio of revenues (from technology exports) and payments for intellectual property (technology imports) as a share of GDP (proxy variable for technology borrowing unit costs).
The choice of proxy variables was based on the popular practice of modeling companies’ or national economies’ innovation (R&D expenditures) and imitation (procurement of off–the–shelf technologies) strategies [Schewe, 1996; Slivko, Theilen, 2014]. All indicators in the range under consideration were processed using the geometric mean method except S, to which the arithmetic mean principle was applied due to the negative values. Sixty–one economies were included in the final statistical sample, for which data was available for at least 11 observations of each variable. Missing values were reconstructed as the average of the two adjacent points. In several cases the averaging out was performed over an incomplete time series. Accordingly, econometric dependences were built on the basis of a spatial sample, since analyzing panel data is not suitable for identifying the overall dependence for specific periods with the subsequent comparison of the TFs over time. In addition, the high volatility of S was noted over long time ranges. All variables except for the share of investments in fixed assets were subjected to standard normalization x: xn=(x–xvin)/(xmax–xmin), for the whole sample or for the relevant cluster.
Clustering economies
To make sure the calculations are correct, it must first be determined which economies should be considered for TF identification, and for which this objective would be meaningless. For this purpose, the initial array of countries was clustered to subsequently build specific regression dependences for the resulting groups. Obviously, dependences will turn out to be different for country clusters with different development levels. Using a single model for the entire sample would likely yield overestimated or underestimated results. The models previously applied for a single array of countries [Polterovich, Tonis, 2005] were refined here. We have also used the most recent data, which adjusted the previous estimates.
Clustering amounts to breaking economies down into advanced and catching–up ones. A two–step procedure was applied for this purpose. At the first stage, machine methods were used for the initial identification of several groups of countries. In most cases single, full, and average connections and centroids were calculated to determine the distance between the clusters, using the Ward method (ward.D). The centroid technique demonstrates the greatest correlation with other instruments, while the Ward method identifies uniqueness. All approaches except the last one produced one disproportionately large cluster and several small ones. This result was unsatisfactory, since too small samples do not allow for building statistically significant regressions. Nevertheless, at this stage a primary pattern could be observed: whatever grouping method was used, the first echelon mainly included countries whose R&D expenditures as a share in GDP exceeded 1.5%. The preliminary clustering produced two groups of countries, primarily based on the R&D expenditures value. We were unable to build any significant regressions for these clusters, despite the obvious relationship between the variables.
At the second stage the machine clustering was calibrated by three sequential operations: sorting the economies by the D indicator value in descending order, calculating the correlation coefficients between D and P (a sequential assessment of the correlation for the top two, three, four, etc. countries), finding threshold points where the correlation coefficient’s sign changes, and “humps” signaling changes in the strength of the correlation (Figure 1). Figure 1 shows the distribution of countries by the nature of the relationship between indicators D and P, with the exception of South Korea. Accordingly, all countries with values higher than the Czech Republic’s were included in the first cluster, since starting from it the correlation coefficient becomes less than 0.2 in modulus (which indicates a relatively weak connection). Interestingly, 16 out of 18 countries in the first cluster were included there by the machine method. Breaking the group of catching–up countries down into sub–clusters did not yield a positive result. Moreover, an additional manual calibration of the second cluster using sliding correlation coefficients showed that the parameter D was not pivotal for it, and neither was S. However, sorting the second cluster by the indicator P did produce a positive result, albeit without an explicit sinusoid as in the first cluster. The final number of countries included in the second cluster was 43.
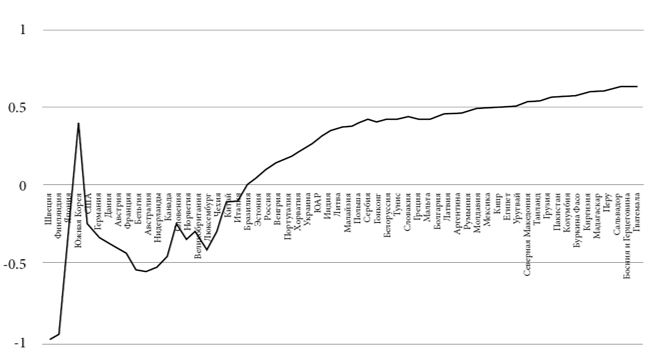
Figure 1. Sliding Correlation Coefficients between Indicators D and P
Source: author.
[Sweden; Finland; Japan; South Korea; US; Germany; Denmark; Austria; France; Belgium; Australia; Netherlands; Canada; Slovenia; Norway; UK; Luxembourg; Czech Republic; China; Italy; Brazil; Estonia; Russia; Hungary; Portugal; Croatia; Ukraine; South Africa; India; Lithuania; Malaysia; Poland; Serbia; Hong Kong; Belarus; Tunis; Slovakia; Greece; Malta; Bulgaria; Latvia; Argentina; Romania; Moldova; Mexico; Cyprus; Egypt; Uruguay; North Macedonia; Thailand; Georgia; Pakistan; Colombia; Burkina Faso; Kyrgyzstan; Madagascar; Peru; El Salvador; Bosnia and Herzegovina; Guatemala]
Empirical Identification of the Technological Frontier
The initial hypothesis for subsequent calculations was the premise that different country clusters would have different TF values. The final test of the proposed hypothesis and the validity of clustering the economies comprised building two econometric dependences. If models can be built for each cluster, would have good statistical characteristics, and yield consistent results, we can assume the clusters were identified correctly. Otherwise, the clustering should be considered invalid and different procedures applied to perform it. Differences in the TF values across clusters should confirm the heterogeneity of this parameter for the global economy. For the first cluster (which includes advanced countries) the following pair of econometric relationships was obtained:
 (6)
(6)
N=18; R2=0.157; BP=2.18 (significance point 0.14); GQ=0.18 (0.99).
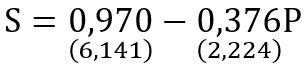 (7)
(7)
N=18; R2=0.236; BP=0.01 (0.96); GQ=3.29 (0.07).
The resulting models (6) and (7) have satisfactory statistical characteristics. The β coefficient in model (6) is significant at an 11% level, which is acceptable for the sample with values averaged out for a long interval. The absence of heteroscedasticity was verified using the Brousch–Pagan (BP) and Goldfeld–Quandt (GQ) tests, with satisfactory results for both models. A more thorough verification of models (5)–(6) was not carried out since its results were used for the applied calculations of a “virtual” TF which is of an auxiliary nature (see below).
Given the average value of investments’ share in GDP for the first group of countries at 22.6%, the calculation of TF for models (6) and (7) yielded the value P*=108.2%, which is outside the acceptable range. In other words, econometric calculations confirmed that for the advanced economies cluster, the TF problem is meaningless, while the TF itself becomes “virtual”. This fact requires a comment from the point of view of the structure of models (6) and (7). In a conventional situation two effects normally tend to occur: R&D learning (β<0) and the growth of borrowed technologies’ costs (β*>0). However, for advanced countries, the latter effect was inversed (β*<0), which has a rather transparent interpretation: for countries supplying innovations to the market, technologies become even more accessible and cheap due to labor productivity growth. Thus, for leader countries both supply and demand curves become decreasing. They intersect beyond the 100% point since along the entire abscissa axis the unit costs of creating new technologies domestically for these countries remain lower than the unit costs of foreign equipment (Figure 2).
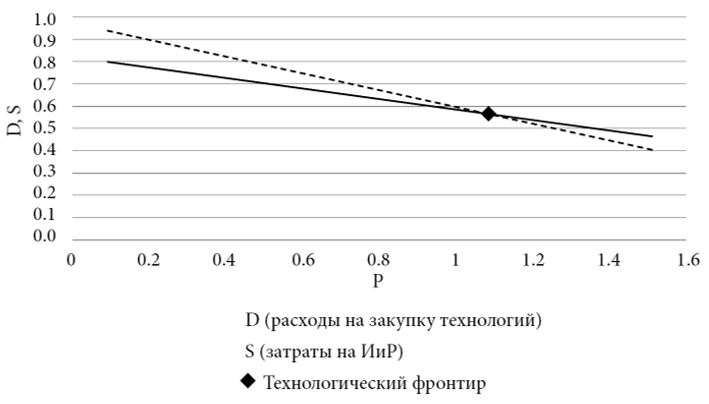
Figure 2. Know–How Supply and Demand Curves for the Advanced Countries Group
Source: author.
[technology procurement expenditures; R&D expenditures; Technology frontier]
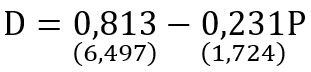
For the second cluster (catching–up countries), the following econometric relationships were identified:
.jpg) (8)
(8)
N=43; R2=0.448; BP=0.31 (0.86); GQ=0.33 (0.99); Chow=1.01 (0.40).
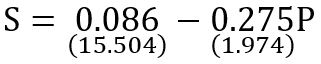 (9)
(9)
N=43; R2=0.087; BP=1.27 (0.26); GQ=2.75 (0.02), BPwt=1.51 (0.47); Chow=1.84 (0.17).
The constructed models (8) and (9) also have satisfactory statistical characteristics. The β* coefficient in model (9) is significant at a 6% level, which essentially does not reduce the reliability of the obtained estimates. One of the tests revealed signs of heteroscedasticity in model (9), but an additional White’s test (BPwt) indicates its absence. The second cluster models have been verified using the Chow test; satisfactory results were obtained for both equations, which indicates the calculated dependences are stable.
Since for the second group of countries the investments’ share in GDP is 21.8%, the TF calculation for models (8) and (9) yielded the value Р*=71.7%. That is, for the “catching–up” countries, the TF identification problem is highly relevant. In their case the learning and increased cost effects are classic, while the supply and demand curves (8) and (9) are multidirectional (Figure 3). Furthermore, the resulting value implies that developing economies face a serious innovation barrier. Accordingly, before starting to implement R&D projects they will have to achieve labor productivity of at least two–thirds of the US level, among other things by borrowing and applying foreign technologies. Only then would launching national initiatives to develop domestic innovations would make sense.
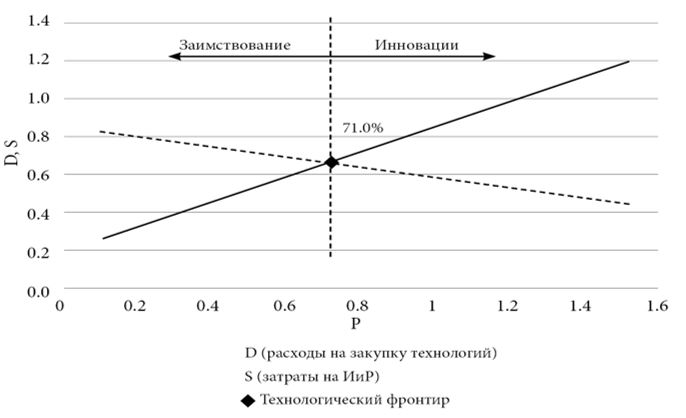
Figure 3. Know–How Supply and Demand Curves for the Catching–up Countries Group
Source: author.
[technology procurement expenditures; R&D expenditures; Technology frontier]
There are two interesting and unexpected aspects about the obtained results.
The first is increase in the TF over time. In our previous work [Balatsky, 2012], the TF was “roughly” estimated at 61.5%, while the above “fresher” calculations resulted in a value of 71.7%, i.e., 10 pp more. If we do not write the resulting discrepancies off to the nuances of the algorithms applied to obtain the two estimates, it can be assumed that switching to active innovation policy is harder for “late start” countries. The “borrowing trap” becomes increasingly deeper and stronger: belated economies are forced to keep using foreign technologies for a long time. To break out of this trap one must not just reduce the gap with the leader but come very close to them in terms of labor productivity.
The second factor (which decreases the TF value) is investment activity. Calculations show that an increase in fixed asset investment from 21% to 30% allows one to reduce the TF from 71.7% to 47.5%. Therefore, the technology borrowing trap does not look fatal. If catching-up countries want to overcome it, they must for a while deliberately abandon the consumer mindset in favor of high investment activity. The USSR, South Korea, and China pursued similar strategies in their time. Otherwise, the catching–up period can last indefinitely.
Successful and Unsuccessful Strategies to Overcome the TF
Taking TF into account is very important for catching–up countries since it helps them avoid two types of mistakes: insufficient innovation activity in relation to overall economic potential and its premature build–up in the absence of an adequate basis. Delays in creating a national innovation system when the necessary technological prerequisites are in place would be just as disastrous as attempts to set one up in the absence of a solid economic foundation. Many countries have experience of mistakes and achievements in this field. Below the contrasting roles of TF in innovation policy are illustrated using the examples of South Korea, China, and Russia.
China
Back in the 1980s the archaic Chinese economy could not claim a decent technological level. Local businesses started by imitating and slightly improving foreign products [Yip, McKern, 2016]. Later a policy of integrating Chinese companies in transnational ICT value chains was introduced. Cooperation with Intel, Google, and MediaTek created prerequisites for major technological diffusion and promoted the emergence of domestic enterprises producing high–tech products under Chinese brands. Since 2004, they have created innovations and stepped up R&D [König et al., 2018]; domestic generation of new technologies has become a systemic process. Since the TF has not yet been reached, innovation has not become large–scale. However, the steady growth of R&D expenditures as a share of GDP helps the country to confidently progress towards this mark (Table 1). The imitation strategy supplemented by domestic innovations yielded impressive results: in 2018 nine Chinese companies specializing in advanced industries have joined the world’s top 100 in terms of R&D expenditures. [4]
Table 1. Labor Productivity in Selected Countries Relative to the US Level (PPP), %
|
Year |
China |
South Korea |
Russia |
|
1975 |
n/a |
9.4* |
n/a |
|
1985 |
1.5* |
16.5* |
n/a |
|
1992 |
4.1 |
37.8 |
43.9 |
|
1995 |
5.5 |
43.4 |
35.8 |
|
2000 |
7.0 |
48.2 |
34.1 |
|
2005 |
9.9 |
51.0 |
39.4 |
|
2010 |
15.6 |
57.3 |
43.4 |
|
2015 |
21.7 |
59.3 |
45.2 |
|
2017 |
24.5 |
61.4 |
46.0 |
*Not counting PPP.
Source: author.
South Korea
South Korea’s technological development path can be notionally divided into four stages [El Fakir, 2008]. During the first two the country actively acquired foreign technologies. In 1962-1982 more than 2,000 purchase contracts were completed, whose total value amounted to almost half of all direct investments made during that period [Suh, Chen Derek, 2007]. Protectionist measures to support local corporations (chaebols) were also seen as acceptable [Lee et al., 1996]. At the third stage (1980–1990s), the transition to innovation mode began. As a result, the amount of internal R&D increased and high–tech companies emerged. The fourth stage (which began in the late 1990s) is characterized by a cluster approach to managing the development of national industry and supporting corporations – world leaders. To this end, the country was divided into zones corresponding to their core industries; innovation is promoted taking into account the specific characteristics of each zone [Kim, 2008]. Currently South Korea is close to the TF (Table 1) and has radically increased internal R&D expenditures. In 2018 four Korean companies were among the global leaders in terms of their R&D spending. [5]
Thus, thanks to a consistent innovation policy, South Korea and China have moved from borrowing foreign technologies to creating innovations in a limited number of prospective industries (high–tech clusters). The factor of maturity is being taken into account: being aware that the TF has not yet been overcome, neither government has striven to cover the entire high technology market.
Russia
Since the beginning of major economic reforms in 1992 Russia has adopted numerous strategic documents aimed at promoting innovation. However, no real progress has been made in stepping up the technological level of production. Possible reasons include specific macroeconomic conditions, market structure, and corporate governance; an institutional system which does not meet the requirements for innovation–based development [Gokhberg, Kuznetsova, 2009]; and excessive reliance on state corporations [Simachev et al., 2014]. In our opinion, the main factor explaining the failure of all plans to create a high–tech sector were the attempts to “leapfrog” the imitation stage straight into innovation development. As a result, Russia was unable to noticeably improve its global position in labor productivity and remains far removed from the TF (Table 1).
In addition, numerous internal and external innovations turned out to be unwanted by Russian businesses: the companies needed simple but more productive technologies, while the developers offered sophisticated and untested solutions. This inconsistent policy has led to stagnation in R&D expenditures and the absence of global leaders among national high–tech companies. In the 2018 ranking of companies – the largest R&D spenders – only Gazprom was included (448th place). Without focusing on the tactical mistakes of the national innovation policy, it would hardly be an exaggeration to say that the main problem with modernizing the economy is the absence of internal and external mechanisms for technological dissemination. Even the practices of successful domestic enterprises are still not being adopted by companies specializing in similar areas. External borrowing mechanisms are not fully mature and their application is significantly hindered by international sanctions.
Discussion of Results
The interpretation of TF and the algorithm for its quantitative assessment presented above contribute to the set of useful analytical tools applied in economics. Taking this indicator into account provides a number of advantages. Identifying the TF allows one to very accurately determine the “club” a particular country belongs to. If the actual relative labor productivity is much lower than the TF, we are talking about a technologically backward economy; otherwise it can be classified as a leader. The hypothesis that for technologically advanced countries the very concept of TF as a threshold value is meaningless since they have already reached the innovation development stage was confirmed. On the contrary, for catching-up economies, TF very much remains important for determining their place in the global system.
Understanding a country’s position in relation to the TF allows one to determine which type of technology policy should be the priority: borrowing innovations or creating them. The country examples given in the previous section show that taking this into account helps shape an adequate technology policy and accelerate economic modernization. At the same time, ignoring the existing technological barrier leads to the disorientation of the authorities, unbalanced research and production strategy, chaotic experimentation with various innovation promotion institutions, and setting incorrect priorities for funding and organizing production.
A number of features do not allow for using the TF automatically, in a standardized way. Its content and identification algorithm require careful handling. TF assessments cannot be seen as absolute since the econometric apparatus, despite its potential, does not guarantee the high accuracy of such a complex indicator. In our opinion the actual TF value lies within the ± 3 pp range from the identified one.
The TF we have defined is macroeconomic in nature. At the same time in many countries including Russia labor productivity in different industries can vary by multiple times, and individual companies’ performance in the same industry in different regions – by dozens of times [Balatsky, Ekimova, 2020]. Therefore, a TF macro–estimate provides only a general benchmark for shaping technology policy for the economy. Sectoral and regional analyses will allow one to identify the zones where it would make more sense to borrow technologies or create them on one’s own. Ideally, the TF should be identified for each industry individually, to ensure the source data is comparable. However, at present there is no statistical basis for this, so one could at least follow a general rule regarding the critical TFP value.
The proposed theoretical structure is extremely simplified, so it uses “pure” strategies: borrowing new technologies vs developing them. In reality, many countries adopt mixed strategies, when in certain more backward economic segments the borrowing mode is applied while in others one’s own innovations are developed, which by definition cancels the binary nature of economic and technological policies. Thus, TF indicates the dominant modernization model, while breaking zones down into two modes is the prerogative of a more thorough analysis of the national economy and its technological level.
Even an extremely correct identification of the TF for the entire economy or a particular sector does not tell exactly which mechanisms should be applied for borrowing or creating innovations. Designing such tools seems to be an art and depends upon the competency level of the government authorities. In other words, TF allows for understanding how technological progress should be made at a qualitative level: mainly by imitating or creating one’s own innovations.
The above allows the authors to suggest a thesis about the suitability of using the TF concept in Russian innovation policy, taking into account the previously noted nuances and limitations. At the same time our calculations show that the borrowing of new technologies was extremely ineffective in Russia. Distance to the TF and the rate of approaching it can be used as effectiveness criteria. Thus in 2017 South Korea was just 10 pp away from the TF, while Russia was more than 25. South Korea’s rate of advancing towards the TF in 1992–2017 was 11.2 times higher than Russia’s. In recent years the situation in Russia has improved, but it is still far from being perfect (Table 1). The above criteria were even more striking in manufacturing industries, where labor productivity in Russia in relation to the US was 16.7% and in South Korea – 71.2% (the TF level!). [6] This state of affairs is also confirmed by the rate of industrial robots procurement: according to the International Federation of Robotics, the density of industrial robots in South Korea in 2018 was 774 units (per 10,000 employed), and in Russia only five. [7]
The country’s official documents on S&T development do not set the objective of organizing a systemic, planned borrowing of foreign technologies and the application of domestic ones. Meanwhile this is what TF identification is focused on. Here Russia has an underutilized regulatory reserve for modernizing the economy and potential for the fruitful application of the new indicator. [8]
Conclusion
The presented constructs show that the Schumpeterian analysis of the innovation sphere still remains constructive and can produce new interesting results. Applying the TF concept in its narrow interpretation as the threshold TFP value allows one to significantly advance Schumpeter’s concept about the two technological development phases: imitation (borrowing) and innovation (creation) of technologies [Schumpeter, 1964]. For catching-up economies including Russia, an effective transition from one development phase to the other implies observing specific laws and conditions. One of them is that the developing country must reach the TF; failure to follow this principle leads to inefficient expenditures and hinders development.
Despite the simplicity of the TF concept, in practice it can be unintentionally breached, for various reasons. After the collapse of the USSR and the loss of its industrial potential, Russia moved into the catching–up category but due to institutional inertia, no effective mechanisms for large–scale technology borrowing have been created over the past three decades. The country is not unique in this respect: many nations are trying to gain independence and international credence by promoting their R&D sector despite the national economy’s inadequate technological level. This group of countries seems to include Pakistan, Iran, and Nigeria. Such strategies not only obstruct development, but also provoke various economic imbalances and social tensions.
Bibliography
Balatsky E.V. (2012) Technological Diffusion and Investment Decision. Journal of the New Economic Association, 15(3), 10–34 (in Russ.).
Balatsky E.V., Ekimova N.A. (2020) Internal Sources of Labour Productivity Growth in Russia. World of the New Economy, 14(2), 32–43. https://doi.org/10.26794/2220-6469-2020-14-2-32-43 (in Russ.).
Bessonova E.V. (2007) Evaluation of production efficiency of Russian industrial enterprises. Applied Econometrics, 2, 13–35 (in Russ.).
Dementiev V.E. (2006) Trap of the Technological Dependence and Condition of Its Overcoming in Two–Sector Model of Economy. Economics and Mathematical Methods, 42(4), 17–32 (in Russ.).
Gokhberg L.M., Kuznetsova I.A. (2009) Innovation in the Russian economy: Stagnation before the crisis? Foresight–Russia, 3(2), 28–46 (in Russ.).
Polterovich V.M. (2009) The Problem of Creating a National Innovation System. Economics and Mathematical Methods, 45(2), 3–18 (in Russ.).
Simachev Yu.V., Kuzyk M.G., Feigina V.V. (2014) State support for innovation in Russia: What can be said about the impact of tax and financial mechanisms on companies? Russian Management Journal, 12(1), 7–38 (in Russ.).
Yasin E.G., Snegovaya M.V. (2018) The Role of Innovations in the World Economic Development. Voprosy Ekonomiki, 9, 15–31. https://doi.org/10.32609/0042-8736-2009-9-15-31 (in Russ.).
Acemoglu D. (1997) Training and innovation in an imperfect labour market. The Review of Economic Studies, 64(3), 445–464. https://doi.org/10.2307/2971723
Acemoglu D., Aghion P., Zilibotti F. (2003) Vertical integration and distance to frontier. Journal of the European Economic Association, 1(2–3), 630–638. https://doi.org/10.1162/154247603322391260
Acemoglu D., Aghion P., Zilibotti F. (2006) Distance to frontier, selection, and economic growth. Journal of the European Economic Association, 4(1), 37–74. https://doi.org/10.1162/jeea.2006.4.1.37
Aghion P., Howitt P., Mayer–Foulkes D. (2005) The effect of financial development on convergence: Theory and evidence. The Quarterly Journal of Economics, 120(1), 173–222. https://doi.org/10.1162/0033553053327515
Aigner D., Lovell C., Schmidt P. (1977) Formulation and Estimation of Stochastic Frontier Production Function Models. Journal of Econometrics, 6(1), 21–37. https://doi.org/10.1016/0304-4076(77)90052-5
Alder S. (2010) Competition and innovation: Does the distance to the technology frontier matter? SSRN Electronic Journal, June 1. http://dx.doi.org/10.2139/ssrn.1635789
Andrade L.R., Cardenas L.Q., Lopes F.D., Oliveira F.P.S., Fernandes K.C. (2018) The Impact of R&D Investments on Performance of Firms in Different Degrees of Proximity to the Technological Frontier. Economics Bulletin, 38(2), 1156–1170.
Baldwin W.L., Childs G.L. (1969) The fast second and rivalry in research and development. Southern Economic Journal, 36(1), 18–24. https://doi.org/10.2307/1056804
Battisti M., Del Gatto M., Parmeter C.F. (2018) Labour productivity growth: Disentangling technology and capital accumulation. Journal of Economic Growth, 23(1), 111–143. https://doi.org/10.1007/s10887-017-9143-1
Benhabib J., Perla J., Tonetti C. (2017) Reconciling models of diffusion and innovation: A theory of the productivity distribution and technology frontier (NBER Working Paper w23095), Cambridge, MA: National Bureau of Economic Research.
Caselli F., Coleman I.I., John W. (2006) The world technology frontier. American Economic Review, 96(3), 499–522. DOI: 10.1257/aer.96.3.499
Cincera М., van Pottelsberghe de la Potterie B. (2001) International R&D Spillovers: A Survey. BrusselsBrussels: Université libre de Bruxelles.
Cirera X., Fattal Jaef R.N., Maemir H.B. (2017) Taxing the good? Distortions, misallocation, and productivity in Sub–Saharan Africa, Washington, D.C.: The World Bank. http://documents.worldbank.org/curated/en/492891485178180375/Taxing-the-good-distortions-misallocation-and-productivity-in-Sub-Saharan-Africa, accessed 15.02.2020.
Coad A. (2008) Distance to frontier and appropriate business strategy (DRUID Working Paper 0807), Copenhagen: Copenhagen Business School. https://www.econstor.eu/bitstream/10419/31801/1/572410638.pdf, accessed 15.02.2020.
El Fakir A. (2008) South Korean system of innovation: From imitation to frontiers of technology, successes and limitations. In: Management of Technology Innovation and Value Creation. Selected Papers from the 16th International Conference on Management of Technology (eds. M.H. Sherif, T.M. Khalil), pp. 275–292. https://doi.org/10.1142/9789812790545_0017
Farrell M.J. (1957) The Measurement of Productive Efficiency. Journal of the Royal Statistical Society. Series A (General), 120(3), 253–290. https://doi.org/10.2307/2343100
Filippetti A., Peyrache A. (2017) Productivity growth and catching up: A technology gap explanation. International Review of Applied Economics, 31(3), 283–303. https://doi.org/10.1080/02692171.2016.1249831
Gombau V., Segarra A. (2011) The Innovation and Imitation Dichotomy in Spanish Firms: Do Absorptive Capacity and the Technological Frontier Matter? (XREAP Working Paper 2011-22). https://papers.ssrn.com/sol3/papers.cfm?abstract_id=1973790, accessed 15.02.2020.
Gouveia A.F., Santos S., Goncalves I. (2017) The impact of structural reforms on productivity: The role of the distance to the technological frontier (OECD Productivity working paper № 8), Paris: OECD. https://www.oecd-ilibrary.org/economics/the-impact-of-structural-reforms-on-productivity_6e4a4bf7-en;jsessionid=ocD4z8zimAYXeuT-JLPtgBRG.ip-10-240-5-160, accessed 15.02.2020.
Kim Y.S. (2008) Regional Industrial Policy in Korea – Its Outcomes and Implications. KIET Industrial Economic Review, 2, 17–26.
König M., Storesletten K., Song Z., Zilibotti F. (2018) From Imitation to Innovation? Where Is All That Chinese R&D Going?, New Haven, CO: Yale University. https://economics.stanford.edu/sites/g/files/sbiybj9386/f/kssz_180403_webpage.pdf, accessed 15.02.2020.
Lee M., Son B., Om K. (1996) Evaluation of national R&D projects in Korea. Research Policy, 25(5), 805–818. https://doi.org/10.1016/0048-7333(96)00879-7
No J.Y.A., Seo B. (2014) Innovation and Competition. Korea and the World Economy, 15(2), 155–183.
Paulson Gjerde K.A., Slotnick S.A., Sobel M.J. (2002) New product innovation with multiple features and technology constraints. Management Science, 48(10), 1268–1284. https://doi.org/10.1287/mnsc.48.10.1268.270
Polterovich V., Tonis A. (2005) Innovation and Imitation at Various Stages of Development: A Model with Capital (NES Working Paper). https://papers.ssrn.com/sol3/papers.cfm?abstract_id=1753531, accessed 15.02.2020.
Rabe C. (2016) Capital controls, competitive depreciation, and the technological frontier. Journal of International Money and Finance, 68, 74–102. https://doi.org/10.1016/j.jimonfin.2016.06.003
Sala–i–Martin X.X., Barro R.J. (1995) Technological diffusion, convergence, and growth (Center Discussion Paper 735). https://www.econstor.eu/bitstream/10419/160652/1/cdp735.pdf, accessed 15.02.2020.
Sato K. (1974) The neoclassical postulate and the technology frontier in capital theory. The Quarterly Journal of Economics, 88(3), 353–384. https://doi.org/10.2307/1881941
Scherer F.M. (1967) Research and development resource allocation under rivalry. The Quarterly Journal of Economics, 81(3), 359–394. https://doi.org/10.2307/1884807
Schewe G. (1996) Imitation as a strategic option for external acquisition of technology. Journal of Engineering and Technology Management, 13(1), 55–82. https://doi.org/10.1016/0923-4748(96)00005-7
Schumpeter J.A. (1964) Business Cycles: A Theoretical, Historical and Statistical Analysis of the Capitalist Process, New York: McGraw–Hill
Segerstrom P.S. (1991) Innovation, imitation, and economic growth. Journal of Political Economy, 99(4), 807–827. http://dx.doi.org/10.1086/261779
Slivko O., Theilen B. (2014) Innovation or imitation? The effect of spillovers and competitive pressure on firms’ R&D strategy choice. Journal of Economics, 112(3), 253–282. https://doi.org/10.1007/s00712-013-0361-5
Solow R.M. (1956) A contribution to the theory of economic growth. The Quarterly Journal of Economics, 70(1), 65–94. https://doi.org/10.2307/1884513
Song B.J., Lim D. (2006) Korean Industry Vision 2020 and Megatrends. KIET Industrial Economic Review, 1, p. 8.
Suh J., Chen Derek H.C. (2007) Korea as a Knowledge Economy: Evolutionary Process and Lessons Learned, Washington, D.C.: World Bank Institute, Korea Development Institute.
UNCTAD (2018) The Technology and Innovation Report 2018: Harnessing Frontier Technologies for Sustainable Development, Geneva: UNCTAD. https://unctad.org/en/PublicationsLibrary/tir2018_en.pdf, accessed 15.02.2020.
Yip G.S., McKern B. (2016) China's next strategic advantage: From imitation to innovation, Cambridge, MA: MIT Press.
[1] https://www.enterprisesurveys.org/en/enterprisesurveys, accessed on: 21.06.2021.
[2] https://datacatalog.worldbank.org/dataset/world-development-indicators, accessed on 21.06.2021.
[3] Each country’s productivity value was compared to that of the US which was chosen as the base (benchmark).
[4] https://www.strategyand.pwc.com/innovation1000#VisualTabs1, accessed on 21.06.2021.
[5] https://www.strategyand.pwc.com/innovation1000#VisualTabs1, accessed on 21.06.2021.
[6] Gross value-added statistics were used in the calculations (http://data.un.org/Data.aspx?q=Gross+Value+Added+by+Kind+of+Economic+Activity&d=SNAAMA&f=grID:202;currID:USD;pcFlag:0, accessed on 21.06.2021.), and employment data (https://www.ilo.org/shinyapps/bulkexplorer29/?lang=en&segment=indicator&id=EMP_TEMP_SEX_ECO_NB_A, accessed on 21.06.2021.)
[7] https://roscongress.org/en/materials/perspektivnye-napravleniya-primeneniya-robototekhniki-v-bisnese/, accessed on 21.06.2021.
[8] There are various borrowing mechanisms: introducing tax incentives for foreign companies operating in the country, encouraging domestic enterprises to purchase and apply advanced equipment by deducting the amount of relevant investments from profits, etc. However, this practical issue deserves a separate discussion and goes beyond the scope of our paper, which is predominantly instrumental in nature.
Official link to the article:
Balatsky E. Identification of the Technology Frontier // «Foresight and STI Governance», 2021, Vol. 15, No. 3, pp. 23–34.