
Introduction
It is hardly an exaggeration to say that modern economic science is mostly devoted to studying the economic growth, which, in turn, is identified with civilizational development. This significance of the economic growth phenomenon is associated with many reasons. Among them is the fact that it is not an “inherent” natural mode of mankind existence, but it has lasted for 250–300 years maximum. Before that, for about 10 thousand years, humanity had been in the so–called Malthusian, or the poverty, trap. Thus, the change of the economic regime itself is an extraordinary phenomenon. In this regard, there is a very appropriate statement by D. North: “Economic growth was the exception, while stagnation and decline were the rule...” [1, p. 193].
North’s words obviously suggest that humanity is likely to return to stagnation in the future. However, other researchers share his opinion. For example, R. Lucas states that “Modern theories of sustainable growth ... abstract from studying land supply and limited resources. Such theories can and do explain long economic series well enough, but it cannot last long”; “It is becoming increasingly clear that the legacy of inequality – a by–product of growth – is historically transitory” [1]. T. Piketty is even more adamant: he believes that the idea of the economic growth’s “normality” with a 3–4% annual rate is a typical “illusion from a historical and logical point of view” [2, p. 107]. Consequently, many prominent economists of our time express doubts about the continuation of a long and intensive growth of global production. Recently, a research area related to the “end of growth” has been gaining momentum. For example, R. Heinberg proves that the economic growth has reached a physical limit, and there are three insurmountable obstacles in its path: depletion of important natural resources; deterioration of environment; overaccumulation of state and non–state debt [3]. Thus, society is on the brink of a completely different economic development mode, which involves not a quantitative increase of the mass of goods, but their qualitative improvement.
Considering this, the purpose of the paper is to study a simple macro-model of the economic growth that will help to understand the mechanism of escaping the Malthusian trap and moving to the economic growth regime, as well as to identify the problems that humanity will have to face while returning to the economic stability. These issues are related to sources and conditions of the growth that allow launching accelerated economic development. The novelty of the proposed approach is to review the economic growth as a consequence of the capital circulation process. An important advantage of the constructed model is an explicit correlation of the economic growth rates with a value of return on equity.
Description of economic growth: overview of key ideas
Studies on economic growth are so numerous and diverse that it is impossible to take them all into account. Instead, we will focus only on some aspects of this problem that are related to further model constructions.
Economic growth factors
A common policy of studies on the economic growth factors was set by R. Solow back in 1956 by a model where total output depended on capital volume, labor resources, and technological progress [4]. Subsequent generations of economists refined the Solow model by introducing human capital factor [5], research and development costs [6], degree of a country’s involvement in global economy [7], and so on.
The study of the contribution of the main production factors to the economy’s growth led to the realization of the importance of labor replacement’s elasticity by capital as a measure of the development level of the entire economic system [8]. In particular, scale of this parameter’s influence was used to explain the variance of average per capita income [9], differences in the level of countries’ economic development [10], as well as an area of technological modernization [11]. In general, according to the neoclassical tradition, economic growth is a consequence of fixed capital accumulation [12]. In a sample of the world’s largest economies for the 1870–1979 period, it was revealed that the greatest effect of accelerated capital accumulation was recorded in catching development, when abundant funds are required to launch new industries [13].
We emphasize that the early Solow model was based on the so–called identity for gross investments, which, in turn, allowed us to establish the golden rule for accumulation, depending on the size of the capital–labor ratio. Based on data on the American economy for 1909–1949. Solow showed that the GDP growth in this period was determined by technological progress and capital growth [14]. Thus, the tradition of describing economic growth goes back to taking into account the dynamics of fixed capital accumulation. This thesis will be used as a starting point in the following study.
Accounting of technological progress
The postulate of the dependence of labor productivity on capital–labor ratio was introduced in the earliest growth models [15; 16; 17]. Moreover, this functional dependence had a power form with a coefficient less than 1. One of the empirical confirmations of this approach is a comparison of the dynamics of the US and UK economies: in 1840–1910, while maintaining nearly equal country values of total factor productivity, the US experienced faster growth of labor productivity, which is explained by their almost one–and–a–half superiority in the volume of capital–labor ratio [18].
Later, the one–factor model was successfully used in applied studies. In particular, it was used for clustering the branches of the Chinese economy on the principle of capital–labor ratio adequacy [19]. Similarly, the dynamics of the dependence of labor productivity on capital–labor ratio was shown using the case–study of China at different time intervals [20]. A similar model, taking into account the flow rather than the stock of capital resources, was used to estimate periods of overinvestment for the Moroccan economy between the 1970s and the early 2010s [21]. Thus, the simplicity of the one– factor model does not detract from its diagnostic value and allows obtaining meaningful results.
Subsequently, the Aghion–Howitt model of endogenous technological progress became very popular. It provided a theoretical description for the process of changing different technological generations [22; 23]. At the same time, the power function is preserved, but a special operator of technological progress is additionally introduced, taking into account the change of generations of production technologies [22].
Another empirical test of the hypothesis of a nonlinear relationship between labor productivity and capital–labor ratio was undertaken in 2020. It showed that only in Canada, the US, Russia, France, and Finland, a desired power factor significantly exceeds 1. This indicates the presence of technological economies of scale in them; in other countries, included in the sample, this effect was not recorded [24]. Consequently, the tradition of describing economic growth also implies the idea of a power dependence of labor productivity on technological equipment of a workplace, i.e., on capital–labor of production. Next, this thesis will be taken into account.
Escaping the Malthusian trap
In addition to modeling the economic growth itself, the process of transition from a centuries–old permanent depression to the economic growth regime is of particular interest. Thus, one of the first models to study the stages of the Malthusian trap and conditions for exiting it, based on the analysis of the relationship between labor resources and real wages, was proposed in 1980 [25]. Subsequently, it was expanded and refined [26; 27; 28; 29]. However, the most fundamental work in this area might be the Artzrouni–Komlos model, which takes into account mutually dependent demographic and economic development of the World–System over the past 10 thousand years. Escape from the Malthusian trap, according to its authors, became possible as a result of the industrial revolution, sufficient capital accumulation (growth rate of which exceeded 5% per decade) and a slowdown of population growth (no more than 5% per decade) [30].
Subsequently, the modeling of the escape from the Malthusian trap was continued in the works of foreign [31; 32, etc.] and domestic researchers [33; 34, etc.]. In this regard, we can consider the work [35], written in 2012, a landmark, in which the author speaks about a possibility of two ways for overcoming the Malthusian trap: Western countries achieved this by destroying traditional institutions (communities) and moving to more efficient individualistic institutions, while Asian countries were able to preserve collective values and institutions through their competent modernization. This interpretation of the transition to the growth allows the author to make an intriguing forecast: countries that will show successful catching development in the future include Turkey, Iran, Egypt, and India, while Russia, Latin America, and sub–Saharan Africa will lag behind [35]. In another paper, the author proposes an equation of the economic growth that explicitly links the GDP growth rate with the return on equity (rate of return) [36]. Experimental calculations, carried out by the authors, showed that, in order to obtain positive growth rates, it is necessary to have a special sector in the economy that has extremely high profitability, calculated in hundreds and thousands of percent. This provision is called the special sector theorem, where special refers to a sector of the economy with a profitability exceeding 100% per annum. Subsequently, this thesis was empirically confirmed by a large number of stylized examples from the Modern history [37]. Thus, we can speak of a tradition of building the economic growth models that would simultaneously reveal the mechanism and conditions for the emergence of the growth itself. This principle will be used in further constructions.
Economic growth and return on equity
Heterogeneity of the national economy has been studied from different angles. In particular, this purpose is served by a huge variety of diffusion models designed to describe the creation and dissemination of innovations. Today, it is assumed to distinguish between two types of participants in the innovation market: innovator firms (leaders who create innovations) and imitator firms (ones that borrow an innovation that had previously appeared on the market). However, limitations of diffusion models are related to the empirical fact that different technologies co–exist in the economy and certain industries, and there is no complete transition toward the newest technologies. To explain this fact, the Polterovich–Khenkin model was proposed in 1988 [38]. Subsequently, it was not just generalized [39; 40] and modified [41], but also used for applied calculations based on data on the profitability of the USSR ferrous metallurgy enterprises for 1976 – 1988 [42]. The Polterovich–Khenkin model was a landmark achievement, because it made it possible to combine the process of the economic growth and technological progress within a relatively simple equation, taking into account the factor of different profitability of different enterprise groups.
The problem of the connection between the economic growth and return on equity was raised to a new level in T. Piketty’s scientific bestseller [2]. He offered the following inequality: g < r, where g is the economic growth rate, and r is the rate of return (return on equity). Piketty calls this inequality the third law of capitalism, which means that the recapitalization of capital (property), accumulated in the past, proceeds faster than production increases, which ultimately leads to the deepening of social inequality in all its forms. Thanks to this interpretation, the Piketty effect turns, according to D. McCloskey’s figure of speech, into “the main inequality about inequality” [43]. It has been actively discussed in the scientific literature (for an overview of Piketty’s criticism, see [44]). In particular, J. Galbraith expressed his opinion that the Piketty’s law will disappear as quickly as it appeared [45]; moreover, he tried to “refine” Piketty’s inequality as follows: g<r(1 — u) — h, where u is a capital gains tax; h is the share of a capitalist’s income allocated to charitable purposes. However, more recent constructions allowed obtaining a simple model in which the economic growth rate is explicitly related to the return on equity and does not violate general macroeconomic logic. In addition, Piketty’s inequality emerges from the constructed model as an obvious consequence, which proves its validity [36; 44]. As for Piketty’s observation that the return on equity was 10–20 times higher than the growth rate of production throughout the world history before 1700, [2], experimental calculations showed its validity, and fears about an excessive nature of such a gap in economic values were exaggerated [44; 46].
Thus, we can state the tradition of linking the rates of economic growth in model constructions with the return on equity, which will be continued in further calculations.
Four aspects of the economic growth modeling, discussed earlier, define a coordinate system that allows carrying out analytical constructions within the established traditions without contradicting them.
Fundamental equation of capital accumulation
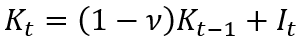
To obtain a simple equation that relates to the rate of the economic growth and return on equity, we use the balance identity of fixed capital accumulation:
 (1)
(1)
where: t is a time period (year); Kt and Kt-1 is a volume of fixed capital in the national economy in a year t and t—1, accordingly; It is a volume of investments in a fixed capital in a year t; v is a fixed capital retirement coefficient (assumed to be constant).
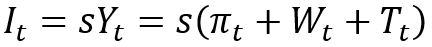
Now let us use the traditional assumption that an annual investment volume I is determined by an average propensity to accumulation (investment) s (assumed to be constant) and the income received Y. With the latter, we assume a traditional GDP aggregate, which, according to the system of national accounts, can be determined by income sources and consists of gross profit n, wage costs W, and net taxes on products and imports T. Therefore, we can write the following equation:
 (2)
(2)
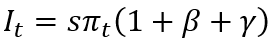
For convenience, let us assume that the GDP structure is stable over time. In this regard, by putting the structural coefficients β=Wt/πt and γ=Tt/πt, we rewrite the equation (2):
 (3)
(3)
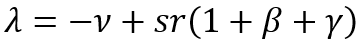
Now we put the formula (3) in (1) and divide the resulting expression by Kt l. If you put the designation for the rate of accumulation of fixed capital λ=Kt/Kt–1–1 and the rate of return on equity r=πt/Kt–1, as well as assume that these two variables remain unchanged over time, we will end up with the expression that we will later call the fundamental equation of capital accumulation (hereinafter – FECA):
 (4)
(4)
As far as we know, the dynamics of capital has not been described in this form before.
The value of the FECA consists in the explicit combination of the rate of fixed capital accumulation with its profitability and propensity to investment. It is this form of the equation (4) that allows it to be used in the future when modeling the economic growth.
Fundamental equation of economic growth
The next step to the economic growth modeling is to consider a single–factor production function:
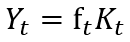 (5)
(5)
where: ft is the capital return, the efficiency of the production of fixed capital.
At the first glance, the function (5) seems somewhat limited due to its univariance, but if we use the identity f = P/k, where P = Y/L and k = K/L, L is a number of people employed in the economy, P is an average labor productivity, k is the capital–labor ratio, then the description (5) will automatically take into account the labor efficiency (P) and the technological equipment of a workplace (к):
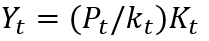 (6)
(6)
which in dynamic form, taking into account the FECA, can be represented as follows:
 (7)
(7)
where: g, ω and σ are the growth rates of output, labor productivity, and capital–labor ratio, respectively.
Hereinafter, the ratio (7) will be called the fundamental equation of economic growth (hereinafter – FEEG). Its significance consists of an explicit link between the economic growth rate (g), return on equity (r), investment activity (s), and parameters of technological progress (ю and a), which was our ultimate purpose. Let us note that the constructed model (7) implies the primacy of the capital accumulation process, and the economic growth becomes its consequence. In other words, an initial phenomenon is the circulation of capital, which, under certain conditions, can generate the economic growth regime.
It should be noted that similar calculations were made in earlier works [36; 44], but they considered less successful forms of accounting for a received income and a profit rate and also did not take into account technological progress in the production sector.
It is easy to see that the Piketty’s inequality g<r goes from the equation (7) as a special case, but its implementation requires a compliance with certain conditions, and it is not automatic and trivial. At the same time, it should be recognized that the Piketty’s inequality almost always works with realistic values of macroeconomic parameters in the FEEG.
Conditions for escaping the Malthusian trap
Although the FEEG (7) can lead to the Piketty’s inequality, it is only a byproduct of the analysis. More important is the definition of conditions under which positive rates of economic growth are ensured at the initial stages of capitalism. The Malthusian trap, strictly speaking, takes place if q=0, where q is per capita GDP growth rate Q=Y/N, N is population size. If we put the population growth rate n, then the equality is valid:
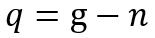 (8)
(8)
This is sufficient to study the conditions that provide a way out of the Malthusian trap when q>0. To do this, we will use a number of simplifying assumptions that reflect the specifics of the period between two epochs – the Middle Ages and Modern Times. We will assume that technological progress in this period was still absent as a systemic phenomenon, i.e. ω=σ=0. Another assumption is related to the lack of population growth, i.e. n=0. The third postulate is based on the absence of a labor market and the phenomenon of wages, i.e. W→0 и β=0. Indeed, the feudal economy assumed that each of its participants acted as an entrepreneur and lived not on wages, but on the income of their enterprise. This does not mean that there was no wage at all in the feudal system, but its existence was extremely local and limited. For example, the class of sailors. They received a certain salary, but the navigation itself often changed, for example, into a pirate fishery, which was a form of a collective enterprise and assumed a share of each participant in total amount of production – income from a business campaign. This example clearly shows that, in the Middle Ages, wages mostly took a form of the net income of an artisan or a peasant. Thus, the condition for the escape from the Malthusian trap takes an extremely simple form: r>ν/s(1+γ). In other words, economic growth implies a certain minimum level of return on equity.
To understand a degree of rigidity of the resulting constraint, let us perform an elementary estimation of the parameters included in it. For example, for the Russian economy in 2008–2018, an average rate of retirement of fixed capital was 10.5% [46, p. 78]; it is unlikely that this indicator was any different in the feudal era [2]. According to available data, the accumulation rate in England before 1760 had not exceeded 6% [35, p. 46]. It is possible to make different hypotheses about the parameter y, however, given that its value for Russia was 30% in 2011–2019, and, in the Middle Ages, there were many excise taxes and customs duties in addition to church tithes, it is quite legitimate to proceed from the value γ=50–70% [3]. Then, as the calculations show, the return on equity should exceed 116.7 and 102.9%, respectively. It is reasonable to assume that, in the late feudal economy when commodity–money transactions were already actively carried out, such a large average return on equity is unrealistic.
The only way to eliminate the contradiction between theoretical and actual figures is to consider two sectors of the economy: normal one with a profit margin r**≈5%, which has been typical for the history of mankind since 1700 [2], and special one with a profit margin far exceeding r*>100% per annum [37]. Accordingly, the share of fixed capital in the special sector is small, and it amounts to ζ=K*/K, whereas the normal sector takes up the rest of the economy — 1–ζ: r=ζr*+r**(1–ζ); r*=π*t/K*t-1; r**=π**t/K**t-1; K=K*+K**, where K* and K** are the volume of fixed capital in special and normal sectors, respectively. In this case, FECA becomes:
 (9)
(9)
While FEEG generalization is as follows:
 (10)
(10)
where the designation V=ω–σ–ν–n is used.
The statement about the necessity of the existence of a special (super–profitable) sector of the economy for the transition from the Malthusian development regime to the economic growth is the content of the special sector theorem [36]. As previously mentioned, a closer examination of the Modern history showed that such sector really existed [37].
This circumstance is of great importance.
First, it clearly shows that the transition to the economic growth regime required an opportunity of obtaining super–profits as a necessary condition. This requirement is extremely serious, but due to a unique combination of circumstances – great geographical discoveries era, brutal colonization of the New and Old World by Europeans, a series of important technological innovations, etc. – it was fulfilled. However, apparently, a sufficient condition for a final destruction of the Malthusian trap included Europeans’ personal qualities, which W. Sombart united into the commercial spirit. It includes various human qualities – ingenuity, religious zeal, flexible logic, greed for profit, aggressiveness and cruelty, ability to count and save, etc. [47, p. 125]. An objective possibility and a subjective desire to enrich coincided at the turn of the epochs for the European peoples. One without the other has repeatedly occurred in history, but it has not led to anything. Without assessing this circumstance, we will only mention immeasurable social sacrifices that Europe required to build capitalism [48].
Second, the FEEG (10) shows that the economic growth history has two fundamentally different phases – initial one, when initial accumulation of capital occurs, and the growth spiral begins, and mature one, when all macroeconomic processes reach their normal value. To show the strictness of the FEEG requirements for amounts of the return rate at different growth phases, we will perform the simplest calculations. Thus, the component s(1+β+γ) at the initial phase (s=6%, β=0, γ=50%) is 0.09, while at the mature phase (s=45%, β=1,12, γ=0,30) — 1.089. Therefore, this component increases by 12 times during the transition from the first phase to the second one, which indicates a radical change of the entire macroeconomic climate and requires an average return on equity of the national economy of only 9.6%, rather than 116.7%. It is the transition period to the growth regime that represents a large– scale historical problem, while maintenance of the steady growth no longer requires too much effort. If we take into account that, in the mature growth phase, technological progress is “turned on” (ω>0), then the requirements for maintaining the national economy on an exponential trajectory are even more sparing.
While discussing the FEEG (10), it is necessary to note the following. Strictly speaking, this model reflects the potential growth of the economy, since it does not take into account the demand for manufactured products, which can reduce the estimated figures. Nevertheless, the equation (10) is sufficient to understand the main economic growth drivers. At the same time, we would like to emphasize that, at the initial stages of establishing the production growth regime, all abnormally low macroeconomic parameters are compensated by the value of the return on equity, which is the basis of the special economic sector theorem. With the growth of other macro parameters, “load” on the rate of profit gradually decreases, and more natural proportions are established in the national economy, allowing to maintain a long–term steady growth without internal stress natural for the initial phase.
Escaping the Malthusian trap: technological economies of scale and population growth
The FEEG (10) is designed in such a way that demographic growth and labor productivity growth act as exogenous factors. To reflect the existing feedbacks in the social system in, at least, the most general way, we introduce two simple assumptions: population growth depends non–linearly on the level of its well-being (per capita GDP), and labor productivity depends non–linearly on the level of capital–labor of production. Then the following relations are valid:
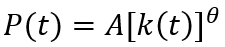 (11)
(11)
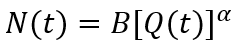 (12)
(12)
where Q=Y/N; A, B, α and θ are constant parameters.
(11) and (12) assume that ω=(θ–1)σ and n=αq, and the FEEG (10) is specified as follows:
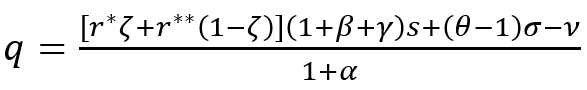 (13)
(13)
Two important conclusions emerge from the formula (13). The first one is obvious, and it consists of the fact that the population growth itself, as production increases (i.e., α>0), does not affect the economic growth, but prevents the escape from their Malthusian trap; accelerated population growth (i.e., α>0) very strongly (by more than two times) inhibits the increase of per capita income. The second conclusion is less obvious, and it means that the dynamics of production depend on the “maturity” of technological progress: if there is a technological effect of scale (i.e. θ>1), then technological progress has a stimulating effect on the economic growth; otherwise, it acts as a slowdown factor. The latter statement seems paradoxical, but its interpretation is quite simple in reality: fixed capital flow stimulates the economic growth, provided that the rate of a workplace price increase does not exceed the rate of labor productivity growth (ω>σ). Violation of this condition means inefficiency of investments in fixed capital or, to be more precise, cost of improving a workplace is not recouped by the scale of labor cost savings; applied calculations have shown that, today, not all countries have technological economies of scale (θ>1) [24].
This suggests that, at the stage of overcoming the Malthusian trap, introduced technological innovations should lead to a mass displacement of production workers, just like, for example, in the implementation of various modifications of a loom. Moreover, it is desirable that, at this moment, there would be no demographic pressure, for which it is necessary to “unload” the labor market. In European countries, it was achieved by strict laws and actions of the authorities (for more information, see [48]).
Thus, theoretical constructions show that the way out of the Malthusian trap implied tough measures of the emerging bourgeois class against the masses of people and a high rate of exploitation of a man by a man. It was this state of affairs that ensured ultra–high profitability of economic operations and allowed us to maintain the intensity of capital accumulation sufficient to launch the economic growth.
An important element of the constructed model is its monocausal nature. For example, there are a lot of works in which the process of the transition from depression to growth is explained by the generation and spread of production technologies, as well as human capital growth in the process of this activity [4] [49]. The idea of considering distribution of wealth among population groups and the resulting political conflict has become popular [50; 51]. At the same time, in nearly all models, impulse to change development regime follows the presence of many (at least two) heterogeneous economic sectors or social groups that differ by many parameters (wealth, amount of human capital, economic efficiency, etc.). According to this idea, heterogeneity of economic segments initiates a large-scale diffusion of resources in an area of more efficient elements of a system. Unlike this approach, the FEEG seems to put all differences between structural elements into one integral indicator for the transition process – return on equity. As for the economy’s heterogeneity factor, it is taken into account in the FEEG in the easiest way – by introducing two sectors with different profitability, and the interaction between them is not explicitly assumed.
Results of model calculations
To test the sensitivity of the national economy to various parameters, to a particular sector’s profitability first of all, we consider 10 scenarios based on experimental calculations using the formula (13) with the r* balancing variable. In this case, we will consider four parameters unchanged: = 30.0%; v = 10.5%; q = 2.0%; r** = 5.0%. The remaining parameters change in ways that allow us to determine the scale of the studied phenomenon (Table).
Results of experimental calculations based on the model (13)
|
Scenario of experimental calculations |
Model parameters |
||||||
|
a |
P |
0 |
a |
s |
Z |
r*, % |
|
|
Initial capitalism phase |
|||||||
|
Scenario No. 1 |
1.0 |
0.00 |
1.02 |
0.00 |
0.06 |
0.1 |
1814.0 |
|
Scenario No. 2 |
0.0 |
0.00 |
1.02 |
0.00 |
0.06 |
0.1 |
1607.6 |
|
Scenario No. 3 |
0.0 |
0.00 |
1.02 |
0.00 |
0.06 |
0.2 |
806.3 |
|
Scenario No. 4 |
0.0 |
0.00 |
1.02 |
0.00 |
0.06 |
0.3 |
539.2 |
|
Scenario No. 5 |
0.0 |
0.00 |
1.02 |
0.00 |
0.06 |
0.4 |
405.6 |
|
Mature capitalism phase |
|||||||
|
Scenario No. 6 |
0.0 |
0.00 |
1.02 |
0.00 |
0.15 |
0.3 |
218.7 |
|
Scenario No. 7 |
0.0 |
0.00 |
1.02 |
0.00 |
0.30 |
0.3 |
111.8 |
|
Scenario No. 8 |
0.0 |
0.00 |
1.02 |
0.00 |
0.45 |
0.3 |
76.2 |
|
Scenario No. 9 |
0.0 |
1.12 |
1.02 |
0.00 |
0.30 |
0.3 |
62.4 |
|
Scenario No. 10 |
1.0 |
1.12 |
1.40 |
0.03 |
0.35 |
0.3 |
57.3 |
Scenario No. 1 captures the most unfavorable development option: there is no technological progress and the wage sector, but there is demographic pressure, negligible investment activity, and a strictly limited size of the special sector. In this case, the return on equity in the special sector should reach four digits in percentage terms (see table). Scenario No. 2 shows that the sole removal of demographic pressure cannot fundamentally change a particular sector’s profitability requirements, but the increase of its relative size lowers the bottom threshold to threedigit values.
Scenarios No. 4 and No. 5 seem to best fit the situation when the British economy was on the eve of universal capitalization. As the calculations show, existence of a fairly solid economic sector with a hundred percent profitability is the main requirement for escaping the Malthusian trap at the initial phase of the capitalist system. We shall recall that the special sector is understood as an economic segment with a profitability exceeding 100% per annum; available historical facts confirm the emergence of many types of businesses with fantastic profit rates in Modern times [37].
Scenarios No. 6–8 show that, in the mature capitalism phase which is characterized by a significant increase of the accumulation rate, the requirement for a special sector’s profitability is significantly reduced – up to the loss of the special sector’s meaning, when its profitability falls to double–digit values. If we add a developed labor sector and modest technological progress to moderately high investment activity, then, as scenarios 9–10 show, even population growth leaves a realistic requirement for profitability of a small part of the economy. Despite this, today, there is still a fairly extensive market segment, where production profitability reaches three digits [37]. In general, at the stage of the mature capitalism phase, the bottom threshold of the economy’s profitability decreases noticeably in comparison with the initial phase.
Growth model for a multi–sector economy
Calculated FEEG (10) is of great importance, since it shows that the heterogeneity of the national economy itself can act as a factor of the economic growth. However, in the equation (10), only two sectors were considered for simplicity — low– and high–profit ones. In fact, the real economy’s sectors (industries, enterprises, etc.) form a certain hierarchical sequence, depending on the level of their efficiency. Moreover, as shown in [38; 39], a steady distribution persists for an indefinite period. In this regard, the equation (10) assumes an obvious generalization, which looks like this in a discrete form:
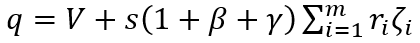 (14)
(14)
where: ri is the return on equity of the i–sector of the economy; ζi is the share of fixed capital in the i–sector of the economy; m is a number of sectors in the national economy.
In a continuous form, the equation (14) will look similar:
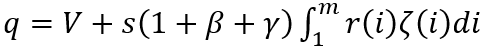 (15)
(15)
where similar designations are used.
In this form, the FEEG allows us to link an uneven development of the economy with the economic growth rate. Moreover, the bottom threshold of the economy’s profitability, which provides a positive GDP growth rate, and the bottom threshold of low–profit industries automatically set the lower level of uneven development of individual sectors. The main advantage of equations (14) and (15) is that they allow us to represent the national economy as a multi–level system, in which each level has its own characteristics of efficiency and scale.
Economic growth driver in early stages of society’s development
According to the FEEG in the form (14) and (15), the national economy is a hierarchical system, which allows us to look at the economic growth’s sources in a new way. In particular, the formation of capitalism led to the consolidation of the return on equity or the rate of profit (percentage), which is the same thing, as the main measure and criterion for success of any economic activity. However, interest in various forms had existed long before capitalism, but it did not contribute to the launch of the economic growth. This fact needs a systematic explanation, which can be given in terms of the equation (14).
So, a general provision emerges from the equation (7): only a sufficiently large average rate of return can provide positive rates of the economic growth. Only when the quantity changes to quality, this parameter begins to act as a driver of total production growth. However, a sufficiently high return on capital not just provides the investment flow necessary to support economic growth, but also acts as an incentive for a lot of people to take on risky activities. This point is a key one for the psychology of an entrepreneur, you need super–profit, not just profit, to generate an unquenchable interest in business among large groups of population and force them to move to active actions – despite possible threats and obstacles.
It is super–profit that causes a thirst for profit, which, in turn, acts as a driver of business activity. It is unlikely that the conquistadors’ conquests would have taken place with the capital income of 10–15% per annum at stake. Only a fabulous interest of capital by current standards could ignite the spirit of entrepreneurship among people. However, a clarifying point, which goes from the equation (14), is that fabulous wealth is possible only in some business types, while other industries are forced to settle for much more modest incomes. For example, the spice trade with a profit rate of 600–700% per annum encourages shipbuilding, and it requires the construction of ports and warehouses, etc. In other words, business impulses diverge across all other sectors of the economy – from the most profitable activity up to routine and unprofitable industries. Thus, if there is a profitability level hierarchy of economic sectors, a certain multiplier effect arises. Because of it, business activity spreads throughout the economy from top to bottom – from super– profitable activities to non–profitable enterprises.
Once again, we emphasize that, in the feudal economy, even usurers and speculators of city bonds could count on tens of percent of profitability from their investments at best, while the era of great geographical discoveries, combined with early industrialization, allowed the emergence of production and trade types with the profitability reaching hundreds and thousands of percent [37].
The fact that the phenomenon of business super–profitability was widespread in the early capitalist economy is no less important. It was a desire of large groups of people for rapid enrichment that acted as an economic growth driver. Consequently, a struggle to maintain a monopoly on super–profitable niches of the economy was the direct cause of numerous cruelties and abuses of Europeans in relation to each other and other peoples. As G. Arrighi showed, from that point on, control of the profit rate became the main task of the capitalist management system [52].
Conclusion
History shows that the phenomenon of the economic growth, capitalist system, steady technological progress, and civilized institution of private property, including intellectual property, emerged simultaneously. This suggests that the collapse of this four–component system would also occur simultaneously and mean the end of capitalism. The FEEG, obtained in the previous sections, contains the parameters of all these phenomena and, thus, shows essential aspects of the economic growth. In addition, the equation (7) implies not only the Piketty’s inequality, but also strict conditions for its fulfillment.
This, among other things, allows a constructive discussion of the final phase of capitalism. For example, existing over–accumulation of capital and decline of its profitability, up to the introduction of negative interest rates by banking systems in many countries, is a big problem for maintaining economic growth. There has never been such a capital impairment before. In addition, the United States and European countries introduce laws that allow homeless people to occupy someone else’s empty house. Such a denial of the fundamental right for private property has never been observed before. If we assume that Piketty’s fears about the impending zero return on capital are correct, then, according to the equation (7), the economic growth can only be achieved by very intensive increases of labor productivity and increased service life of production equipment. Such a development means a rapid robotization of production, which, apparently, represents the final phase of capitalism. We should not discount the fact that the economic growth has almost reached its physical limit when its preservation is fraught with the complete destruction of a human habitat. If we take into account that the primacy of capital, economic growth, technological progress, and property rights are intertwined and do not exist without each other, then we can talk about emerging signs of the end of the capitalist system.
It is unlikely that capitalism has exhausted itself, and humanity is ready for a completely different social model of existence. However, if this happens, we can only wonder what a new driver of further economic development will be.
References
- North D. Ponimanieprotsessa ekonomicheskikh izmenenii [Understanding the Process of Economic Change]. Moscow: HSE Publishing, 2010. 256 p.
- Piketty T. KapitalvXXIveke [Capital in the Twenty–First Century]. Moscow: Ad Marginem Press, 2016. 592 p.
- Heinberg R. The End of Growth: Adapting to Our New Economic Reality. Cabriola Island, B.C.: New Society Publishers, 2011. 321 p.
- Solow R.M. A contribution to the theory of economic growth. The Quarterly Journal of Economics, 1956, vol. 70, no. 1, pp. 65–94.
- Uzawa H. On a two-sector model of economic growth. In: Readings in the Theory of Growth, 1971, pp. 19—26.
- Romer P. Are nonconvexities important for understanding growth? National Bureau of Economic Research, 1990, no. w3271. Available at: https://www.nber.org/papers/w3271.pdf (accessed: 12.02.2020).
- Malawi A.I., AlMansi M. Economic globalization and labor productivity: An Application of Autoregressive Distributed Lag (ARDL) Bounds Testing Approach. International Journal of Business and Statistical Analysis, 2014, no. 1, pp. 49–55.
- Knoblach M., Stockl F. What determines the elasticity of substitution between capital and labor? A literature review. DIWBerlin Discussion Paper, 2019, no. 1784. Available at: https://papers.ssrn.com/sol3/paperscfm?abstract_id=3339171 (accessed: 12.02.2020).
- Klump R., de La Grandville O. Economic growth and the elasticity of substitution: Two theorems and some suggestions. American Economic Review, 2000, no. 90 (1), pp. 282–291.
- Caselli F. Accounting for cross–country income differences. In: Durlauf P.A., Steven N. (Eds). Handbook of Economic Growth, 2005, vol. 1, part A, Elsevier, pp. 679–741.
- Acemoglu D. Labor– and capital–augmenting technical change. Journal of the European Economic Association, 2003, vol. 1, pp. 1–37.
- Mankiw N.G., Phelps E.S., Romer P.M. The growth of nations. Brookings Papers on Economic Activity, 1995, vol. 1, pp. 275–326.
- Wolff E.N. Capital formation and productivity convergence over the long term. The American Economic Review, 1991, vol. 81, no. 3, pp. 565–579.
- Solow R.M. Technical change and the aggregate production function. The Review of Economics and Statistics, 1957, no. 39(3), pp. 312–320.
- Kurz M. The general instability of a class of competitive growth process. Review of Economic Studies, 1968, no. 35, pp. 155–174.
- Goldman S.M. Optimal Growth and Continual Planning Revision. Review of Economic Studies, 1968, no. 35, pp. 45–54.
- Hahn F. On warranted growth paths. Review of Economic Studies, 1968, no. 35, pp. 175—184.
- Broadberry S.N., Irwin D.A. Labor productivity in the United States and the United Kingdom during the nineteenth century. Explorations in Economic History, 2006, no. 43 (2), pp. 257–279.
- Jefferson G.H., Rawski TG., Zhang Y Productivity growth and convergence across China’s industrial economy. Journal of Chinese Economic and Business Studies, 2008, no. 6 (2), pp. 121–140.
- Dollar D. Economic reform and allocative efficiency in China’s state–owned industry. Economic Development and Cultural Change, 1990, no. 39 (1), pp. 89–105.
- Ezzahid E., Nihou A. Capital deepening and efficiency in Morocco. MPRA Paper, 2017, no. 82143. Available at: https://pdfs.semanticscholar.org/7ce8/a96a40a5c6449ce9e54ea94f28175e105698.pdf (accessed: 12.02.2020).
- Aghion Ph., Howitt P. A model of growth through creative destruction. Econometrica, 1992, vol. 60, no. 2, pp. 323–351.
- Aghion Ph., Howitt P. Capital accumulation and innovation as complementary factors in long–run growth. Journal of Economic Growth, 1998, no. 3, pp. 111–130.
- Balatsky E.V., Yurevich M.A. Technological economies of scale and economic growth. Terra Economicus, 2020, vol. 18, no. 1, pp. 43–57 (in Russian).
- Lee R. A historical perspective on economic aspects of the population explosion: The case of preindustrial England. In: Population and Economic Change in Developing Countries. Ed. by R.A. Easterlin. Chicago, IL: University of Chicago Press, 1980. Pp. 517–566.
- Wood J.W. A Theory of preindustrial population dynamics, demography, economy, and well–being in Malthusian systems. Current Anthropology, 1998, no. 39, pp. 99—135.
- Voigtlander N., Voth H. Malthusian dynamism and the rise of Europe: Make war, not love. American Economic Review: Papers & Proceedings, 2009, no. 99(2), pp. 248–254.
- Ashraf Q., Galor O. Dynamics and stagnation in the Malthusian epoch. 1, 2011, no. 101(5), pp. 2003–2041.
- Meller N., Sharp P. Malthus in cointegration space: A new look at living standardsandpopulation in pre industrial England. Journal of Economic Growth, 2014, vol. 19, no. 1, pp. 105–140.
- Artzrouni M., Komlos J. Population growth through history and the escape from the Malthusian trap: A homeostatic simulation model. Genus, 1985, vol. 41, no. 3–4, pp. 21–39.
- Steinmann G., Prskawetz A., Feichtinger G. A model on the escape from the Malthusian trap. Journal of Population Economics, 1998, no. 11, pp. 535–550.
- Kogel T, Prskawetz A. Agricultural productivity growth and escape from the Malthusian trap. Journal of Economic Growth, 2001, vol. 6, no. 4, pp. 337–357.
- Korotaev A.V., Malkov A.S., Khalturina D.A. Zakony istorii: Matematicheskoe modelirovanie razvitiya Mir– Sistemy. Demografiya, ekonomika, kul’tura [Laws of History: Mathematical Stimulation of the Development of the World System: Demography, Economics, Culture]. Moscow: Lenand, 2019. 230 p.
- Grinin L.E., Korotaev A.V., Malkov S.Yu. Mathematical models of socio–demographic cycles and the escape from the Malthusian trap: Some possible directions of further development. In: Problemy matematicheskoi istorii: matematicheskoe modelirovanie istoricheskikh protsessov [The problems of mathematical history: Mathematical modelling of historical processes]. Ed. by G.G. Malinetsky, A.V. Korotaev. Moscow: URSS, 2008. Pp. 78–118 (in Russian).
- Popov V.V. Why the West got rich before other countries and why China is catching up with the West today? New answer to the old question. Zhurnal Novoi ekonomicheskoi assotsiatsii=Journal of the New Economic Association, 2012, no. 3 (15), pp. 35–64 (in Russian).
- Balatsky E.V., Ekimova N.A. Foreign trade factor in eliminating the Malthusian trap. In: Ekonomicheskaya teoriya i khozyaistvennaya praktika: global’nye vyzovy: mater. mezhdunar. Konf. «Evolyutsiya mezhdunarodnoi torgovoi sistemy:problemy iperspektivy – 2016» [Economic theory and practice: Global challenges: Proceedings of the international conference “Evolution of the international trade system: Problems and prospects – 2016”]. St. Petersburg: Sankt–Peterburgskii gosudarstvennyi universitet, 2016. Pp. 165–172 (in Russian).
- Balatsky E.V., Ekimova N.A. Driving the economy: The role of a special economic sector. Journal of New Economy, 2020, vol. 21, no. 3, pp. 5–27 (in Russian).
- Polterovich V.M., Khenkin G.M. An evolutionary model of interaction between the processes of creating and borrowing technologies. Ekonomika i matematicheskie metody=Economics and Mathematical Methods, 1988, no. 6, pp. 1071–1083 (in Russian).
- Polterovich V.M., Khenkin G.M. Evolutionary model of economic growth. Ekonomika i matematicheskie metody=Economics and Mathematical Methods, 1989, 3, pp. 518–531 (in Russian).
- Henkin G.M., Polterovich V.M. A Difference-Differential Analogue of Burgers Equation and some Models of Economic Development. Working Paper #WP/98/051. Moscow: CEMI of Russian Academy of Science, 1998. 61 p.
- Tashlitskaya Y&.M., Shananin A.A. Modelirovanie protsessa rasprostraneniya tekhnologii [Modeling of Technology Diffusion Process]. Moscow: Vychislitel’nyi tsentr RAN, 2000. 50 p.
- Gel’man L.M., Levin M.I., Polterovich V.M., Spivak V.A. Modeling the dynamics of the distribution of enterprises in the industry by levels of efficiency (on the example of ferrous metallurgy). Ekonomika i matematicheskie metody=Economics and Mathematical Methods, 1993, vol. 29, no. 3, pp. 460–469 (in Russian).
- McCloskey D.N. Measured, immeasurable, exaggerated and groundless pessimism. About the book “Capitalism in the Twenty-First Century” by Thomas Piketty. Ekonomicheskaya politika=Economic Policy, 2016, vol. 11, no. 4, 2016, pp. 153–195 (in Russian).
- Balatsky E.V. The effect of Piketty: a comment to new concept. Terra Economicus, 2017, vol. 15, no. 2, pp. 40–56 (in Russian).
- Galbraith J.K. Unpacking the first fundamental law. Real-world Economics Review, 2014, no. 69, 7 October, pp. 145–148.
- Balatsky E.V. Institute of social inequality and economic growth. Zhurnal institutsional’nykh issledovanii=Journal of Institutional Studies, 2020, vol. 12, no. 1, pp. 66–83 (in Russian).
- Sombart W. Burzhua: etyudypo istorii dukhovnogo razvitiya sovremennogo ekonomicheskogo cheloveka [Bourgeois: Studies on the History of the Spiritual Development of a Modern Economic Person]. Moscow: TERRA – Knizhnyi klub, 2009. 637 p.
- Balatsky E.V. Primary accumulation of capital: Institutional dilemma. Zhurnal ekonomicheskoi teorii=Russian Journal of Economic Theory, 2013, no. 4, pp. 58–69 (in Russian).
- Veselov D.A. Market failures and government failures in the model of transition from stagnation to growth. Zhurnal Novoi ekonomicheskoi assotsiatsii=Journal of the New Economic Association, 2011, no. 12, pp. 24–40 (in Russian).
- Yarkin A.M., Veselov D.A. Wealth distribution and political conflict in the model of transition from stagnation to growth. Zhurnal Novoi ekonomicheskoi assotsiatsii=Journal of the New Economic Association, 2016, vol. 32, no. 4, pp. 30—60 (in Russian).
- Veselov D.A. The dynamics of social conflict during the transition from stagnation to growth. Revue d’Economie Politique, 2019, vol. 129, no. 5, pp. 833–859.
- Arrighi G. Dolgii dvadtsatyi vek: Den’gi, vlast’ i istoki nashego vremeni [The Long Twentieth Century: Money, Power and the Origins of Our Time]. Moscow: Territoriya budushchego, 2006. 472 p.
[1] Lukas R.E. Lectures on Economic Growth. Moscow: Gaidar Institute Publishers, 2013. 288 p. Pp. 253, 256.
[2] Concept, and even accounting, of the average rate of fixed capital retirement did not exist in medieval economy. In this way, we can talk about a proxy variable, which is a value inverse to an average service life of farmers and artisans’ production equipment.
[3] Since there were no subsidies for production and import of certain goods in feudal economy, and taxes were regularly withdrawn on the background of low profits, it could be assumed that, in the Middle Ages, the parameter y was noticeably higher than in the past. Due to lack of such reporting data, we take the most realistic interval value of the parameter y.
[4] See: Veselov D.A. Transition from stagnation to development in the theory of economic growth with human capital: diss. ... Cand. of Sci. (Econ.). Moscow: NRU HSE, 2012.
Official link to the article:
Balatsky E.V. Return on equity as an economic growth driver // «Economic and Social Changes: Facts, Trends, Forecast», 2021, vol. 14, no. 1, pp. 26–40.