
The Russian economy is currently in a quasi–equilibrium state of hidden inflation. On the one hand, there is no galloping inflation but, on the other hand, it occasionally reveals itself in inflationary spirals, which are quite painful for both ordinary customers and economic agents. For example, the first months of 2001 saw a sharp growth of inflation. Besides, the general monetary situation is fraught with a potent surge of inflation, if not an explosion of current prices. Speaking figuratively, inflation has turned into a Damocles’ sword for the Russian economy. As the problem of resistance of the various branches of Russia’s economy to the latent inflationary tendencies is regaining its topicality once again, let us estimate, by using 1995–1997 data, the maximum inflation rates that the domestic industries can withstand without going into recession.
Active Inflationary Taxes as a Reproduction Factor. One of the mechanisms by which inflation affects production dynamics is the so-called active inflationary taxes [I]. Its general scheme as applied to an economic unit is as follows: there is always a time lag between the input of resources and the receipt of earned revenues; under inflation, it leads to the overestimation of profits in all economic transactions (in specialist literature, such profit is sometimes called inflationary or holding [2, p. 20]); in taxation, part of the company’s income is “wrongfully” skimmed of the inflationary excess profit (which is known as the effect of active inflationary taxes [1, p. 52]); the depreciated manufacturing expenses for intermediate uses (of raw materials, equipment, and semifinished products) prove to be insufficient for the product reproduction chain owing to a rise in raw material prices; and to repeat the work cycle in the former volume, the company has to replenish the required funds out of its net profit. Given an excessive rate of inflation and an overly long input–output time lag, an enterprise may face a shortage of funds to maintain the production at the former level, and have to gradually scale down its operation.
The above mechanism underlay the collapse of many industries and production units in the Russian economy in the period of high inflation rates. This mechanism of active inflationary taxes is still in effect, although not so conspicuously as in the early 1990s.
Elsewhere, we have proposed a dynamic company model taking into account the effect of active inflationary taxes [1, pp. 46–47]. Yet, estimates made according to this model had several weak points. Firstly, these estimates aimed at fixing a critical (marginal) operating cycle period for preset inflation rates. It is more significant, however, to use the estimated operating cycle as initial data for defining threshold (critical) inflation rates. It is precisely this approach we applied in the present article. Secondly, quantitative standard measures obtained by the above model, albeit revealing the scale of the phenomenon, fail to clear up the critical inflation rates for enterprises with a longer operating cycle. For example, it was established that, under the 5% and 10% average monthly inflation rates, the critical operating cycle period should be 1.6 and 1.5 months respectively. As fiscal conditions worsen, it decreases to 0.9 and 0.8 months [1, p. 51]. Thirdly, all the estimates were made for the entire economy, i.e., for the averaged Russian enterprise. The main purpose of this article is to obtain differentiated inflationary indicators for various industrial segments having dissimilar reproduction characteristics.
To take the above remarks into due consideration, we shall modify the statement of our problem. All industries differ widely in both their input pattern and operating cycle period, which accounts for their varying degree of vulnerability to the growth of inflation rates. To assess the marginal inflation rates that an industry can withstand under simple reproduction (i.e., at the zero rate of economic growth), it is necessary calculate the average operating cycle period for each industry, including the time required for the processing of primary resources into the finished product (the work or individual production cycle) and its marketing (the trade or turnover cycle). By complementing the estimated operating cycle period by the structure of production costs, it is possible to make model estimates of the critical inflation rate. The latter acts as an indicator of industries’ inflation vulnerability or, vice versa, stability: the higher the critical inflation rate, the stronger is an industry’s resistance to inflationary tendencies. In our analysis, we can get along with an aggregated industry classification, which includes 10 broad segments. (Our factorial analysis is discussed in the final section of this article.)
Estimating an Industry’s Operating Cycle Period. The length of a complete operating cycle for aggregated economic entities such as a branch of industry is not directly observable. It has to be estimated indirectly from the structure of its floating funds. To this end, use can be made of the following formulas:
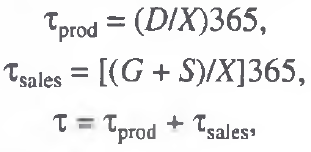
where D is the volume of incomplete production; X is the output (cumulative sales); G is the stock of finished products for resale; S is the debt receivable from customers; and  ,
,  and
and  are the time (in days) of production, marketing, and complete operating cycles respectively.
The estimation of a production cycle is based on the goods–in–process inventory. Depending on the recurrence of incomplete production during a year, it is easy to calculate its period, which is identified with the production cycle. The length of a trade cycle is estimated from the stock cycle of finished-goods, and the time elapsed from their shipment to the time of full payment for them through the index of debt receivable from customers. It should be pointed out that such “cleaning” of enterprises’ floating assets for estimating their complete operating cycle is imperative because it is methodologically invalid to assess their total turnover period, as it leads to multiple overstatements.
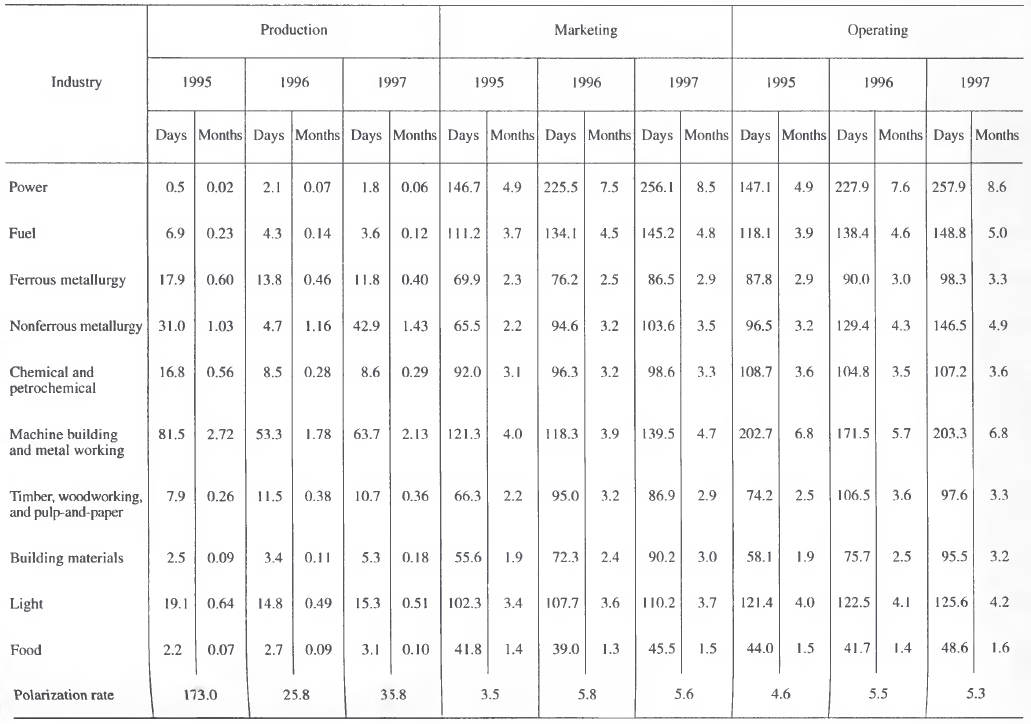
This estimation of the operating cycle period is based on data furnished by Russia’s State Committee for Statistics (Goskomstat) on the structure of floating assets in industry [3, p. 111], the volume of industrial production [4, pp. 186–197], and the debt receivable from customers [5, p. 160]. Estimates made by the above formulas are presented in Table 1.
Table 1. Cycle periods in branches of industry
They are further subjected to qualitative analysis. To validate our calculation method, we do not much need longer or more “recent” retrospective series. Moreover, bringing our time series up to date is difficult for purely technical reasons: the latest Goskomstat data books for 1998 and 1999 failed to include essential statistics on the floating assets of Russian industries. Our task is to demonstrate the efficiency of our method on concrete data and get an insight into possible quantitative effects by using a toolbox which can estimate such inflationary effects for any period.
Technological and Marketing Shifts in Industry. While estimating an operating cycle period, it should be kept in mind that this index adequately reflects the technological efficiency of industrial production: the shorter the production cycle, the higher is the technological efficiency of the respective industry. Similarly, the marketing cycle characterizes the efficiency of its marketing (trading) infrastructure.
Our results led us to the following conclusions.
First, the length of a production cycle is incomparable with that of marketing. In 1997, for example, the production cycle in electrical engineering was 144 times shorter than its marketing cycle, while in the machine building industry, where this gap was minimal, it was 2.2 times shorter. This fact points to the marketing sphere as the current bottleneck of the Russian economy. For comparison, the reverse situation prevailed in the economy of the former USSR in the 1950s. E.g., the production cycle in its heavy industry totaled 98 days against 82 days in the marketing cycle. The respective figures for the paper industry were 62 and 30 days, for forestry, 68 and 56, for food, 44 and 44, and for light industry, 52 and 22 [6, p. 7]. As we can see, the problem of disposal was less significant for the postwar Soviet planned economy than that of production. This conclusion accords well with the general government policy of the time, which aimed mainly at the production sphere. Conversely, thanks to an extended postwar period of technological progress, during enterprises’ transition to a market economy, prime attention was given to removing bottlenecks in the technological sphere, while an underdeveloped trading system, against the background of a shrinking effective demand, turned into a stumbling block to economic growth.
Second, the technological disparity between Russian industries is very great and does not match their differences in the marketing sphere. For example, the technological polarization coefficient [1] was almost 50 times higher than the respective index in the marketing cycle in 1995, 4.4 times higher in 1996, and 6.4 times higher in 1997. Therefore, essential differences between industries are most noticeable at the stage of production, whereas their manifestation in the marketing cycle is, on the contrary, insignificant. In the process of time, technological disparity showed a downward tendency, while the marketing differences had an upward bias (see Table 1). This fact suggests that the market optimization of economic activities revealed itself primarily in the “internal” (technological) sphere, whereas in the “external” (trade) sphere, industrial enterprises engaged in a keen rivalry characterized by spontaneity and the lack of immediate results. The total rate of polarization was increasing, indicating a growth of differences in industries’ business environment (see Table 1).
Third, technological shifts in the period under review were generally far more progressive than those in the marketing sphere: five out of ten industries (ferrous metallurgy, machine building, light, fuel, and chemical) cut back their production cycle [2]. By and large, the technological shifts proved to be uncertain, leading only to a slight “castling” of industries (e.g., the chemical industry had outstripped forestry). In the marketing sphere, all the industries showed a decline in their indexes as a result of both the deterioration of the macroeconomic marketing conditions and the lack of proficiency in operating in the new environment. The superimposition of tendencies in the production and marketing spheres, with a visible marketing factor bias, affected the mobility of all, except for the chemical industry, which shortened its production cycle by 1.6 days.
Hence, in the mid–1990s, recessive tendencies prevailed in Russian industry, weakening its resistance to would–be surges of inflation. Of course, this conclusion cannot be regarded as absolutely valid for all the subsequent years. An analysis of each separate sector shows that, in engineering terms, the power, building–materials, fuel, and food industries hold the most advantageous position. By contrast, the machine–building industry, given high inflation, finds itself immediately in a crisis, since it cannot considerably shorten its work cycle without the complete modernization of its production facilities, especially under recession and fiscal deterioration.
Yet, a shorter production cycle does not necessarily guarantee economic prosperity. For instance, the power industry and the fuel industry are losing their unique technological advantages because of marketing problems. However, if they manage to normalize their relations with their customers, their inflation stability could be one of the highest. Meanwhile, they are also most vulnerable to any price fluctuations.
Naturally, the food industry displays the highest degree of inflation tolerance. Our calculations show that the building materials industry is more adapted to an inflationary environment than is light industry. As a whole, our estimates confirm the general pattern: the “heavier” industries with a longer operating cycle are more vulnerable to inflation.
Estimating Industries’ Critical Inflation Rates. Knowing an industry’s operating cycle period and its cost structure, it is possible to make a rough estimate of the inflation rate at which it can still maintain the simple reproduction mode. Let us use the following equation [1, p. 47]:
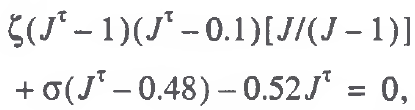
where ζ is the share of intermediate inputs (material costs) in the output; σ is the share of labor costs; J is the average monthly price growth index, which is assumed, for simplicity, to be equal to the wage growth index and the material price growth index. (The above equation was solved by means of numerical experiments, since it is nonlinear with respect to the inflation index.)
The cost coefficients presented in Table 2 were estimated from the Goskomstat statistics for the input structure in industry [4, p. 335].
Table 2. The structure of industrial costs, in %
|
Industry |
Input–output ratio |
|||||
|
material |
labor |
|||||
|
1995 |
1996 |
1997 |
1995 |
1996 |
1997 |
|
|
Power |
60.4 |
63.3 |
59.9 |
6.4 |
6.7 |
6.4 |
|
Fuel |
44.5 |
44.6 |
41.7 |
6.4 |
7.4 |
7.8 |
|
Ferrous metallurgy |
65.2 |
68.3 |
70.4 |
6.1 |
8.7 |
9.2 |
|
Nonferrous metallurgy |
49.2 |
53.5 |
51.6 |
10.6 |
14.9 |
13.9 |
|
Chemical and petrochemical |
58.3 |
60.5 |
58.1 |
6.4 |
8.1 |
8.6 |
|
Machine building and metal working |
53.3 |
47.8 |
50.7 |
14.2 |
14.6 |
15.7 |
|
Timber, woodworking, and pulp–and–paper |
47.4 |
49.8 |
49.2 |
11.7 |
15.2 |
15.4 |
|
Building materials |
37.9 |
37.5 |
40.3 |
8.8 |
9.4 |
0.3 |
|
Light |
50.5 |
47.7 |
49.6 |
12.9 |
15.5 |
16.9 |
|
Food |
53.3 |
47.4 |
47.2 |
7.3 |
7.8 |
7.9 |
|
Polarization rate |
1.7 |
1.8 |
1.7 |
2.3 |
2.3 |
2.6 |
As seen from Table 2, the share of intermediate inputs is rather high in all industries with only minor relative differences. The spread of labor costs is more significant, markedly identifying segments with a high rate of the own–product real wage (machine building, pulp–and–paper, and light industry).
The effects observed in the dynamic pattern of industrial costs are multidirectional. In the period under review, for example, the input–output coefficient declined in the power, machine–building, fuel, chemical, light, and food industries. So, more than half of the Russian industries went over to the resource–saving mode of operation, which well correlates with changes in their work cycle periods. By contrast, the share of labor costs in all the industries, except for power, has noticeably increased, which correlates with the dynamics of industries’ marketing cycles.
Despite marked differences in the structure of industrial costs, our analysis of inflation stability is based mainly on one factor, since the operating cycle still plays the decisive role in the formation of threshold inflation rates. This is due primarily to the rather narrow range of fluctuations in cost parameters in contrast to the quite significant variations in operating cycle periods. (E.g., the complete operating cycle at the ship–, aircraft– and rocket–building plants, as a rule, exceeds one year, whereas the turnover of products in the public catering outlets may be over within a day.)
Inflation Stability of Russian Industries. Critical average monthly inflation growth rates were calculated from the data listed in Tables 1 and 2. The differentiated threshold rates of inflation for the production, marketing, and complete operating cycles are given in Table 3. An analysis of the latter data reveals that the technological factor is in no way limiting the emerging level of industries’ inflation stability.
Table 3. A cycle's threshold average monthly inflation rates, in %
|
Industry |
Production |
Marketing |
Operating |
||||||
|
1995 |
1996 |
1997 |
1995 |
1996 |
1997 |
1995 |
1996 |
1997 |
|
|
Power* |
– |
– |
– |
–3.0 |
–5.2 |
–5.0 |
–3.0 |
–5.3 |
–5.0 |
|
Fuel* |
– |
– |
– |
4.5 |
–0.5 |
–1.7 |
4.3 |
–0.9 |
–2.0 |
|
Ferrous metallurgy |
121.4 |
119.8 |
130.6 |
5.8 |
–2.7 |
–5.3 |
1.6 |
–4.4 |
–6.1 |
|
Nonferrous metallurgy |
63.5 |
21.0 |
13.2 |
6.5 |
–8.9 |
–8.5 |
–2.8 |
–10.4 |
–10.0 |
|
Chemical and petrochemical |
225.2 |
763.0 |
887.0 |
3.3 |
–1.9 |
–2.3 |
0.5 |
–2.8 |
–3.3 |
|
Machine building and metal working** |
–6.9 |
5.0 |
–4.0 |
–9.9 |
–9.6 |
–11.2 |
–10.1 |
–10.5 |
–10.9 |
|
Timber, woodworking, and pulp–and–paper |
2071.7 |
392.5 |
481.3 |
4.5 |
–9.0 |
–8.2 |
1.2 |
–9.8 |
–9.3 |
|
Building materials* |
– |
– |
– |
36.7 |
15.8 |
2.6 |
32.8 |
13.5 |
1.1 |
|
Light |
137.9 |
233.3 |
170.7 |
–7.1 |
–9.9 |
–11.5 |
–8.4 |
–10.6 |
–11.9 |
|
Food |
– |
– |
– |
41.3 |
61.7 |
43.4 |
36.9 |
53.1 |
37.3 |
* The sign denotes virtually unlimited inflation stability.
** Minus means deflation, i.e., the industry can only operate under a general price drop.
Machine building stands apart from all the other industrial sectors. It is the sole industry with a long production cycle so long that, even given the instantaneous sale of its products, it nevertheless goes into recession at the slightest growth of inflation. Still, the rise in the machine–building equipment turnover in 1996 could keep this industry afloat at a monthly price increase of 5%, which amounts to more than 60% a year. Admittedly, even the year 1996 cannot be taken as a model since in reality, in addition to the work cycle, there is also the marketing cycle. However, already in 1997, this industry failed to operate even at a level as low as that. Its objective technological characteristics are extremely “unfavorable,” which should be taken into account when drawing up projects aimed at macroeconomic regulation and, in particular, government support measures.
The marketing sphere is a stumbling block to domestic industry. In 1997, for example, only two sectors proved to be capable of operating in an inflationary environment, while all the rest failed to solve the problems of arrears, strain on liquidity, and limited demand. The timing of marketing bottlenecks is rather uneven. In 1995, e.g., only the power, machine-building and light industries failed to operate under inflation; all the rest displayed quite strong resistance to inflation. This seems to suggest that the stability of basic industries is an extremely dynamic characteristic, which can radically change within one or two years. Thus, the technological factor can only in special cases foster a change in an industry’s status. Therefore, the observed sharp shifts in the industries’ inflation vulnerability are due primarily to the marketing factor, which is closely with all the economic cycle phases. The technological factor has a long–term effect on inflation stability whereas the marketing factor is responsible for majority of short–range fluctuations. Hence, the marketing fluctuations caused a dynamic “reshuffle” in the threshold rates of inflation in industry in 1995–1997.
By 1997, only the building-materials and food industries showed an ability to operate in an inflationary environment. And out of the two, only the latter had maintained its active capacity, even enlarging its “anti–inflationary potential,” while the building–materials industry was steadily approaching the group of outsiders. In 1995, this industry had the margin to withstand, e.g., a threefold annual rise in prices, whereas in 1997, it could only oppose inflation at 10–11% per annum. Light industry displayed the most apparent anti–inflationary degradation, turning into the worst–performing sector by 1997. By arid large, it can be stated that only one–fifth of the Russian industries appeared to be immune to inflation in 1997 (against over 50% in 1995).
The structural factor, though not determining industries’ status, can still significantly change their ranking according to the criterion of inflation vulnerability [3]. In 1997, e.g., the operating cycle in electrical engineering was twice that of the light industry, whereas its inflation vulnerability was 2.4 times lower. This seemingly paradoxical situation results from the light industry’s less advantageous input pattern. In this respect, it should be pointed out that a high share of intermediate uses and lower labor costs are more preferable for the development of industries’ strong resistance to inflation. This is the underlying reason for the “heavier” industries displaying more preferable antiinflationary characteristics than “lighter” branches. Therefore, the growth of labor productivity and the cost saving through the reduction of hired labor are the most essential factors in increasing an industry’s inflation stability.
Factors Cushioning the Effect of Active Inflationary Taxes. Estimated values of the threshold inflation rate reveal industries’ potentialities, but it is impossible to directly ascertain the real state of affairs on their basis. Theoretically, it means that, if the estimated threshold inflation rate for an industry turns out to be lower than the actual value, this industry is bound to go into a recession. In practice, however, there are exceptions. For example, a comparison of production growth rates (Table 4 [7, p. 379]) with the respective threshold inflation rates (see Table 3) fails to reveal any correlation.
Table 4. Average annual growth rates of production, in %
|
Industry |
1995 |
1996 |
1997 |
|
Power |
–3.0 |
–2.0 |
–2.0 |
|
Fuel |
–0.8 |
–1.0 |
0.3 |
|
Ferrous metallurgy |
10.0 |
–2.0 |
1.0 |
|
Nonferrous metallurgy |
3.0 |
–4.0 |
5.0 |
|
Chemical and petrochemical |
8.0 |
–7.0 |
3.0 |
|
Machine building and metal working |
–9.0 |
–5.0 |
4.0 |
|
Timber, woodworking and pulp–and–paper |
–0.7 |
–17.0 |
1.0 |
|
Building materials |
–8.0 |
–17.0 |
–4.0 |
|
Light |
–30.0 |
–22.0 |
–2.0 |
|
Food |
–8.0 |
–4.0 |
–0.8 |
Yet, a thorough analysis allows us to notice the following development dynamics in domestic industry: over the interval of 1995–1996, characterized by high Inflation rates, it is apparent that the rise (or decline) in threshold inflation rates led to the growth (or decline) in production rates; and in 1996–1997, the slackening rates of inflation violated this tendency. This fact shows that the indicators of industries’ inflation vulnerability can adequately predict possible shifts in their production activity mainly at high inflation rates; but under the slackening in these rates, active inflationary taxes become less significant, other factors “outweighing” them in their effect on production dynamics.
Several groups can be identified among factors determining the breach of correlation between threshold inflation and economic growth rates. For example, we proceeded from the hypothesis of zero structural inflation: In reality, however, price advance varies from industry to industry. Specifically, end–user industries find themselves in a better position since, as a rule, the prices for their products are rising faster than those for their material resources (in some cases, it is vice versa). There are also monopoly industries, which can dictate prices for their products. All these factors relieve the burden of active inflationary taxes, enhancing the inflation stability of respective industries. Besides, in recent years, rises in commodity prices have been attended by a rather rigid wage freeze, which was also instrumental in extenuating crisis processes in the majority of industries.
A direct effect of such factors is negative threshold rates of inflation, diagnosing a crisis situation in the industry, although its real output is growing (see Table 3). To avoid disparities between theoretical and actual results, it is necessary to take into account the differences between three price indexes: for finished products, resources, and labor. Regrettably, owing to the lack of reliable information, such account is a problem in its own right; therefore, the accent in this paper was placed on qualitative analysis.
Another problem arising in the verification of industries’ estimated inflation stability is the inadequacy of initial statistics owing to the frequent distortion of some economic indicators already at their primary reporting stage.
Yet, the debenture mechanism is the chief cause of disparity between the industries’ estimated inflation vulnerability and their growth rates. In addition to debt receivable, in particular, accounts due from customers, which prolong and complicate the marketing cycle, there are accounts payable, which substantially simplify this cycle. In other words, one sector of industry can shift its own problems connected with clients’ arrears onto other economic agents. Industries differ widely in their capacity to use this debenture instrument to defuse financial shortages. For example, at a relatively moderate threshold rate of inflation, electrical engineering was continually operating in the recession mode owing to its negative debit–credit balance, which forced it to act as a “creditor” for all the other industries [2, p. 22] and weakened its reproduction potential. Conversely, the machine-building industry was highly vulnerable to inflation against the background of a rather moderate rate of decline in its production in 1995–1996 and its growth in 1997. This situation is easily explained if one takes into account that the debt compensation rate [4] in machine building was 169% in 1995 against 47% of the industry average [2, p. 21]. A completely different situation arose in light industry, where the high rates of inflation vulnerability were attended by a steep decline in production, which was also due to a low debt compensation rate, as little as 42% in 1995 [2, p. 21].
Among the factors that predetermined the incipient growth tendency in industrial production, at least two deserve special mention: the decline in actual rates of inflation and, as evident from available data of some economic entities [8, p. 126], the ongoing growth in the accounts payable rate (the ratio of accounts payable to sales proceeds).
The “baffling” mechanism of arrears, which precludes the automatic usage of estimates of industries inflation vulnerability, gives, rise to an “inflationary asymmetry”: even satisfactory estimates of a threshold inflation rate do not necessarily guarantee production growth in a given industry. The source of its crisis may lie in other factors, in addition to active inflationary taxes. The diversity of such factors is virtually unlimited.
Nonetheless, the above quantitative results quite accurately reveal the state–of–art in sectors of industry. As the crisis deepens, the operating cycle in any industry gets longer, which makes it more vulnerable to any leaps in prices, aggravating, in turn, depressive tendencies. Thus, there appears in the system a positive feed forward and feedback mechanism, which hinders the normalization of economic activities. Conversely, a perceptible improvement in market conditions leads to the shortening of the operating cycle and the growth of the inflationary stability of industrial enterprises, stimulating the advance of the economy toward recovery.
Conclusions. Our analysis shows that systematic disturbances in the marketing sphere were the main problem in domestic industries’ efforts to restore their inflation stability in 1995–1997. The problem of arrears, most pressing in industrial production, led to the accrual of debts and, therefore, the extension of the operating cycle, eliciting an extremely sensitive response of industrial plants to any surges of inflation. At the same time, nonpayments acted as a powerful mechanism for cushioning the depressive effect of active inflationary taxes, which conceals the actual state of affairs in Russian industry, reducing the indicative value of many economic parameters.
The enduring large–scale nonpayment practice, underlying a system of debtors’ pardon, with endless delays of payment or the writing–off of debts, is one of the factors determining the extension of the trade cycle. This is particularly evident from the relations of the fuel–and–energy complex with its contracting parties. If the marketing sphere is to be streamlined, the bankruptcy procedure must be normalized and financial discipline must be tightened. Simultaneously, it is advisable to adopt stricter rules of the payment for goods and services (e.g., to shorten the payment deadline from 90 to 30 days) and introduce stricter enforcement mechanisms. Clearly, at the level of industrial enterprises, closer attention should be given to the trade cycle to secure timely sales of their products.
At high annual rates of inflation (over 15%), a differentiated taxing system seems to be preferable [1]. Tax exemptions should be granted to machine building and nonferrous metallurgy as industries with an objectively long production cycle, which cannot be shortened even in quite normal business conditions.
In the last few years (1998–2001), the commercial climate has definitely changed for the better. It can be assumed that all the shifts have generally contributed to enhancing the inflation stability of Russian industries. However, to gain objective results confirming this conclusion, it is indispensable to update, as far as possible, the estimates made according to the proposed calculation method. Recognizing the latest tendencies in this sphere will allow us to make short–term forecasts for the stability of individual industries in the evolving monetary environment.
References
1. Balatskii E.V. Inflationary Taxes and Economic Growth, Ekon. Mat. Met., 1997, no. 3.
2. Sal’nikov V.A. The Financial Resources of Industries: Formation, Usage, and Interindustry Distribution, Probl. Prognozir., 2000, no. 3.
3. Promyshlennost’ Rossii. Stat. Sb. (Russian Industry: A Data Book), Moscow: Goskomstat RF, 1998.
4. Rossiya v tsifrakh. Kratkii stat. Sb. (Russia in Figures: A Short Data Book), Moscow: Goskomstat RF, 1999.
5. Finansy Rossii. Stat. Sb. (Russian Finances: A Data Book), Moscow: Goskomstat RF, 1998.
6. Alymov A.N. Normirovannost’ oborotnykh sredstv v ugol’noi promyshlennosti (The Normalization of Current Assets in the Coal Industry), Moscow: Gos. nauch.–tekh. izd–vo liter, gomomu delu, 1960.
7. Rossiiskii statisticheskii ezhegodnik. Stat. Sb. (Russian Statistical Yearbook: A Data Book), Moscow: Goskomstat RF, 1998.
8. Semenikhin A.I. Restructuring Enterprises: From Local Solutions to Systems Approach, Probl. Prognozir., 2000, no. 3.
[1] The coefficient is calculated as an industry sample’s maximum to minimum ratio, e.g.:.png) . As applied to the production cycle, the minimum value in 1995 was registered in electrical engineering, and the maximum index, in machine building.
. As applied to the production cycle, the minimum value in 1995 was registered in electrical engineering, and the maximum index, in machine building.
[2] Strong dynamic fluctuations in the relative length of the work cycle in electrical engineering deserve special mention. Although these fluctuations in absolute terms vary within 0.5–1.5 days, the relative gap is quite wide. In our view, this is explained by the Uneven development of this industry, primarily in the renovation of its production capacities. The wear and tear of old equipment the commissioning of new facilities can radically change an industry’s respective average indexes.
[3] As can be seen from the equation defining threshold inflation rates, instrumentwise, structural cost coefficients seem to act as weight factors for operating cycle effects. Clearly, this “weighing system” can change the role of the operating cycle in the formation of an industry’s inflation stability.
[4] The debt compensation rate refers to the ratio of the industry’s accrued total debts to its gross income.
Official link to the article:
Balatskii E.V., Kolesnichenko M.A. Inflation Vulnerability Factors in Russia’s Industry// «Studies on Russian Economic Development», Vol. 12. No. 6. 2001. pp. 596–603.