
General description of the problem
The issue of hired labor exploitation is highly relevant for Russia today. It is obvious to many that fortunes of billions made by the present generation of oligarchs in a matter of years cannot represent a natural outcome of their labor. Yet, a much more intriguing aspect to this issue becomes visible when one analyzes the pattern of functioning of private capital. Here, the question can be rephrases: Does the result of workers’ labor is still being appropriated by private capital, or has this process come to a stop? In theory, it is perfectly possible that initial appropriation of property has taken place and hereafter a regular labor compensation system evolved. Scholarly analysis is concerned not with an one–off action of appropriation of public property but the permanent process of underpayment for labor. This is precisely what generates the main contradiction between hired labor and capital.
This problem is rooted in K. Marx’s labor theory of value, although presently it has, of course, a different interpretation and lends itself to different solution techniques. Afterwards, Western economic thought proposed a solution in the framework of the theory of production functions. There were isolated attempts to revisit the issue of exploitation of man in Russia as well; see, e.g., [1]. What is the current attitude to this problem?
First and foremost, it is eminently clear today that the labor theory of value is inapplicable to the assessment of the level of labor exploitation. The reason is that this theory handles deals with fuzzy economic categories, which in practice do not lend themselves to unambiguous quantification. An approach based on the use of the econometric tools of production functions appears to be much more constructive. Furthermore, it makes it possible to move the problem of labor exploitation to a more general level of research, which is concerned with the study of the price structure of macrofactors. This approach was first used in [2]. Afterwards, the fact of disagreement of equilibrium and actual prices of macrofactors was applied to the study of the phenomenon of labor market flexibility [3].
Second, indicators that have traditionally been used to build macroeconomic production functions should be revised, because they include many components preventing a correct estimation of the equilibrium prices of macrofactors. This involves, primarily, the “cleaning” of the GDP aggregate as the resultant indicator of the process of combining labor and capital.
Guided by these concepts, we can identify the equilibrium prices of labor and capital, compare them with actual values and, on this basis, not only to estimate the level of exploitation of labor, but also give a fuller description of the labor and capital markets in economic equilibrium terms.
An important methodological premise of the selected ideology is the assumption that the generation of net income depends on only two factors, labor and capital. This seems to be a perfectly legitimate postulate as all the other potential factors are integrated one way or another into the qualitative and quantitative indicators of labor and capital. Accordingly, the distribution of net income properly occurs only between these two factors. This “valid” two–factor scheme can only be realized by the most correct recognition of net income.
Detecting distortions of the equilibrium prices of macrofactors
The starting point of our analysis is the joining of hired labor and capital in the production process. The labor factoi is accounted for as employment volume, L, and capital, as fixed investment, I. The first factor (the worker) receives compensation in the shape of an average wage, W, and the second (the employer), in the shape of average rate of return per unit investment, r. Then, the net income X gained as a result of production is the sum of the labor compensation fund and the mass of profits:
X = WL + rI (1)
where r = π/I; π is the mass of clean profit gained by the employer after all taxes and payments.
Thus, net income is calculated by formula (1), where all the four variables (L, W, I and π) are initial statistical aggregates involved on both micro– and macrolevels.
We must now determine the equilibrium prices of labor and capital. We assume that the relation of net income X to macrofactors is described by a homogeneous production function of degree of homogeneity v: X = X(L, I). Then, the following Euler expansion is valid:
 (2)
(2)
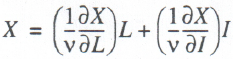
The relationships in parentheses in (2) are the equilibrium prices of macrofactors: W* = (l/v)(∂X/∂L) is equilibrium wage, and r* = (l/v)(∂Х/∂I) is equilibrium rate of return. It is readily apparent that, with this interpretation, the equilibrium prices of factors are determined by their marginal productivity rates, and hence, correspond to the real production contribution of each factor to X generation.
An approach based on net income index (1) differs from conventional schemes of building of macroeconomic production functions, where GDP figures as output indicator. By our logic depreciation must be subtracted from GDP as, strictly speaking, it goes for the return of past fixed investment and does not contribute to net income generation. Simultaneously, all the taxes must be subtracted from GDP, because this money aggregate, even though it is fully a part of value added, does not come into direct use of either employees or employer (the capital owner). In fact, this is a deduction from earned revenue, to be subsequently used to maintain the public sector for the common good–both employees and employers.
Thus, equation (2) shows the generation of net income in keeping with the mass and efficiency of macrofactors, and formula (1), net income expenditure on the compensation of macrofactors according to their mass and actual steady price.
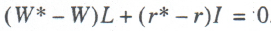
By joining (1) and (2) we arrive at a fundamental equation for labor and capital markets:
 (3)
(3)
In accordance with equation (3), generally, in the macrofactor market, there is always a price equilibrium: if a factor’s services are underpaid on one market, they are overpaid on another market. In other words, if the actual price of one factor is understated, that of another is automatically overstated.
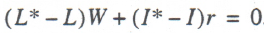
Assuming that aggregate demand and aggregate supply are in equilibrium on the commodity market, Walras’s law for a macroeconomic system can be written as
 (4)
(4)
In accordance with formula (4) there is always global equilibrium in the system: if there is excess demand on one market, there is excess supply on another. For example, is unemployment is on the rise in a country, underinvestment will necessarily be felt.
A comparison of (3) and (4) reveals their striking similarity. They can be said to be mirror images of each other. For instance, equation (4) recognizes volumetric market imbalances weighed according to actual prices, whereas equation (3) deals with price distortions on markets weighed by actual volumes of macrofactors. Most important, equations (3) and (4) reflect different aspects of macroeconomic markets, and they were obtained from completely different theoretical premises and assumptions. Their similarity probably characterizes some fundamental general property of market economy, which extends to different aspects of its functioning.
For analytical purposes, the distortion of equilibrium prices should be appraised in relative terms. To this effect, equation (3) must be rewritten to take into account the structural parameter reflecting the share of the wage bill in net income ζ = WL/X:
 (5)
(5)
Equation (5) suggests the need for introduction of indicators of distortion of macrofactors’ equilibrium prices: ε = W*/W – 1, the distortion coefficient of equilibrium wages; μ = 1 – r*/r, the distortion coefficient of the equilibrium rate of return on capital. While both indicators can, theoretically, be used as a measure of labor exploitation, their values are not equivalent. As follows from (5), the degree of distortion on each market depends on the structural coefficient ζ. Sometimes, price distortions are greater on the labor market and sometimes, on the investment (capital) market. Generally, the following dichotomy holds true:
 (6)
(6)
It follows from condition (6) that wherever the wage bill exceeds profit, price distortions on the investment (capital) market will prove to be greater than on the labor market; otherwise, they will be less. In other words, the predominance of the labor compensation fund in net income automatically leads to lesser price distortions in its price compared with the other factor. Leaping ahead, when the disparity between profit and labor compensation fund is very great, even insignificant price distortions on one market may set off an enormous price aberration on another one. Thus, the weight coefficient which is perceived as a technical parameter of the price market, is actually very important for achieving price equilibrium.
Considering that ε = (μ/ζ)(l – ζ), we can introduce an averaging price distortion coefficient for macromarkets: δ = (ε + μ)/2. Precisely this coefficient should be used in practical calculations when assessing the degree of mismatch of the equilibrium and actual prices of labor and capital. Note that M. Weitsman was the first to advance the idea of study of price distortions due to market imperfection [4]. Yet, unlike Weitsman, we examine price aberration in production, not in consumption. Besides, we are concerned with relative rather than absolute measures of distortion.
The proposed approach to appraising the degree of price disequilibrium on macrofactor market is simple enough. However, it places rather great demands and limitations on initial data. First, the production function being identified must be linearly homogeneous, which is by no means always achievable. Second, all the parameters of the function must be positive so as to secure positiveness of marginal productivity of labor and capital.
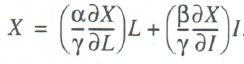
If the first requirement is nonsatisfiable, one can use any two–factor production function that has been built, including a heterogeneous one, but then the factorization of (2) is transformed into the relation
 (7)
(7)
where α, β, and γ are rates of increment of the indicators X, L, and I respectively.
For the factorization of (7) the equilibrium prices of macrofactors take on the form: W* = (α/γ)(∂X/∂L), equilibrium wage; r* = β/γ)(∂Х/∂I), equilibrium ROR. While the problem of function homogeneity is removed by (7), there arises another, rather tight constraint on the rate of increment: ideally, it must be either positive in all cases or negative in all cases. Nevertheless, in most cases factorizations of (2) and (7) allow to estimate the equilibrium prices of macrofactors both for the economy at large and for its individual elements (industries, regions, or individual enterprises).
Econometric estimation of the aberration of the equilibrium prices of labor and capital
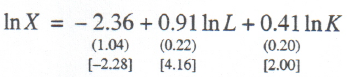
To illustrate this method of estimation of the degree of distortion of macrofactor prices we resort to statistical data of two countries, the United States and Russia. For the United States economy 1987–2000 we build the Cobb–Douglas production function as the following econometric relationship: [1]
 (8)
(8)
N=14; R2 = 0.988; F = 454.14; DW = 1.06.
Regression coefficients (8) have underneath them their standard errors in parentheses and their t–statistics in square brackets; N is number of observations; R2 is coefficient of determination; F is the value of F–statistics; DW is Durbin–Watson coefficient of autocorrelation; a similar system of notation is used in what follows.
Relation (8) passes all tests, including the t–statistics of coefficients of regression at a 90% significance level. Consequently, model (8) is effective and can be used in further applied calculations.
A peculiarity of econometric model (8) is that instead of fixed investment index (I) it uses fixed capital (K) itself. This replacement is perfectly acceptable and it does not lead to any substantive and methodological adjustments in the original scheme, except for a great decrease of ROR.
Calculations of price characteristics for US labor and capital markets by model (8) are listed in Table 1, which leads to the following conclusions.
Table 1. Price characteristics of the US labor and capital markets 1987–2000
|
Year |
W*, $ thou/yr |
W, $ thou/yr |
ε, % |
r*, % |
r, % |
μ, % |
|
1987 |
20.51 |
28.06 |
–26.90 |
6.50 |
1.00 |
–550.34 |
|
1988 |
20.61 |
28.24 |
–27.01 |
6.60 |
1.27 |
–419.64 |
|
1989 |
20.67 |
27.93 |
–26.00 |
6.72 |
1.09 |
–514.03 |
|
1990 |
20.57 |
27.79 |
–25.99 |
6.82 |
1.15 |
–493.58 |
|
1991 |
20.39 |
27.75 |
–26.51 |
6.83 |
1.24 |
–449.29 |
|
1992 |
20.54 |
28.52 |
–27.98 |
6.77 |
1.37 |
–393.35 |
|
1993 |
20.73 |
28.59 |
–27.49 |
6.77 |
1.46 |
–364.56 |
|
1994 |
20.97 |
28.55 |
–26.59 |
6.81 |
1.58 |
–329.48 |
|
1995 |
21.09 |
28.31 |
–25.51 |
6.90 |
1.79 |
–285.99 |
|
1996 |
21.11 |
27.86 |
–24.22 |
7.00 |
1.87 |
–273.50 |
|
1997 |
21.40 |
28.33 |
–24.47 |
7.01 |
1.97 |
–256.13 |
|
1998 |
21.68 |
29.17 |
–25.70 |
7.02 |
1.60 |
–339.61 |
|
1999 |
21.93 |
29.50 |
–25.66 |
7.03 |
1.56 |
–351.28 |
|
2000 |
22.19 |
30.18 |
–26.47 |
7.03 |
1.41 |
–339.55 |
|
Average |
21.03 |
28.48 |
–26.18 |
6.84 |
1.45 |
–387.17 |
First, the rate of exploitation in the United States proves to be a negative quantity (columns 4 and 7). It means that labor is overpaid and capital investment is underpaid. This situation is partly explainable by the fact that the United States is a country overflowing with finances, with a traditionally high potential of skilled labor, and high pay orientation. However, this conclusion is fundamental to our understanding of the country’s socioeconomic system, which has an obvious social orientation even to the prejudice of private capital. One can say that the American system is a materialized model of “capitalist socialism,” which with the domination of the private form of production does not perform that primitive exploitation of labor that Marx referred to. American workers receive an average of 26% more than they deserve. If anything, it is not labor that is exploited by capital in the United States, but the other way around, capital is exploited by labor. This is one of the first paradoxes following from our calculations. It counterbalances the generally known fact of the cruelty of the American hiring system, which, it transpires, does not amount to the primitive appropriation by owners of capital of the results of work of their workers. Hence, what matters for the labor market is not the capitalist form of ownership as such, but the model and specificity of the capitalist system built.
Second, the distortion of the equilibrium prices of labor in the United States was on average almost 15 times less than it was on the fixed capital market. This is due to the fact that clean profit was only a fraction of the labor compensation fund. Therefore, this phenomenon of “self–exploitation of capital” is prejudicial to the American owner of a production facility, and this in a very strong and explicit form. The main conclusion is that the American labor market is much better balanced than the capital market. For all we know, this may be of primary importance for shaping the foreign–economic strategies of US–based transnational corporations, which show high activity in exporting production and capital to other countries.
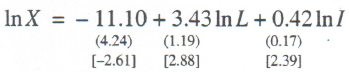
We built also for the Russian economy 1989–2002 a Cobb–Douglas production function given by the econometric relation
 (9)
(9)
N = 13; R2 = 0.964; F= 136.52; DW = 2.14.
Relation (9), like (8), successfully passes all the statistical tests, including the t–statistics of regression coefficients at a 95% significance level. Thus, model (9) is operable and can be used in further applied calculations. [2]
We note that the Cobb–Douglas function is generally applicable to the assessment of production ties relative to net income, which is another confirmation of the productiveness of the proposed approach.
Table 2 lists price characteristics of Russian labor and capital markets calculated by (9), from which several conclusions ensue: [3]
Table 2. Price characteristics of the Russian labor and capital markets 1990–2002
|
Year |
W*, |
W, |
ε, % |
r*, % |
r, % |
μ, % |
|
1990 |
5.23 |
3.63 |
43.92 |
19.59 |
62.55 |
–68.68 |
|
1991 |
4.65 |
3.52 |
32.02 |
20.11 |
65.90 |
–69.49 |
|
1992 |
3.41 |
2.36 |
44.43 |
23.63 |
65.22 |
–63.75 |
|
1993 |
2.97 |
2.37 |
25.19 |
22.58 |
57.16 |
–60.50 |
|
1994 |
2.29 |
2.18 |
5.17 |
21.67 |
46.38 |
–53.27 |
|
1995 |
2.14 |
1.57 |
36.34 |
22.26 |
69.80 |
–68.11 |
|
1996 |
1.87 |
1.66 |
12.81 |
23.35 |
34.86 |
–33.01 |
|
1997 |
1.63 |
1.74 |
–6.32 |
20.44 |
46.02 |
–55.58 |
|
1998 |
1.45 |
1.52 |
–4.46 |
20.07 |
–18.76 |
206.97 |
|
1999 |
1.78 |
1.18 |
50.67 |
25.38 |
82.24 |
–69.14 |
|
2000 |
2.01 |
1.43 |
40.55 |
24.94 |
95.94 |
–74.01 |
|
2001 |
2.11 |
1.72 |
22.44 |
24.07 |
71.34 |
–66.26 |
|
2002 |
2.22 |
1.99 |
11.18 |
25.13 |
48.87 |
–48.58 |
|
Average |
2.60 |
2.07 |
24.15 |
22.56 |
55.96 |
–72.10 |
First, the rate of labor exploitation in Russia is positive and averages 24%. It means that labor is steadily underpaid by about a quarter. The beneficiary is capital, whose rate of return is 72% overstated on average. The fact of overpayment of labor, which took place in 1997–1998, was connected with the currency crisis, which reduced profits to a greater extent than wages, and it does not change the general situation in the Russian economy. Thus, it is much more profitable to be an investor than an employee in Russia. This is also notable, because a country with long–standing socialist traditions eventually implemented a model not even of “socialist capitalism,” which would have been logical, but a “classical capitalism” model with blatant and barefaced exploitation of hired labor. This is another paradox: socialism gives rise to an even more cruel and socially ineffectual brand of capitalism than the one that grows naturally on a traditional capitalist economic platform.
Second, the distortion of equilibrium prices on the Russian labor market was on average three times less than on the fixed capital market. Considering that this distortion was beneficial to capital, one would be quite justified in asserting that Russia can well be a region favorable for foreign investment.
The quantitative estimates of the equilibrium prices of labor and capital for the Russian and US economies we obtained produce a rather logical picture of the world capital turnover. All the countries of the world fall into two large groups, characterized by either (1) overpayment of labor (they include mainly developed economies) [4] or (2) underpayment of labor (they include mainly developing and transition economies). Labor exploitation is present in the second group and is absent as such in the first. If this process is reinforced by high RORs in countries featuring labor exploitation, capital in the first group of countries tends to migrate to the second group. On account of country–to–country capital flows labor exploitation may, in a way, be exported to other countries, primarily those there the equilibrium wage is above the actual one. To be sure, this scheme of the flow of the exploitation phenomenon from country to country is not universal, yet the very fact of there being two groups of countries differing in this characteristic is significant by itself.
Distortion of the equilibrium prices of macrofactors and labor market flexibility
Our examination of factor price equation (3) and Walras’s law (4) revealed their organic unity, yet, their relationship is still unclear. It is quite obvious that labor market price distortions affect, one way or another, the state of the market itself, including the demand and supply aggregates. A similar situation is found on the investment market.
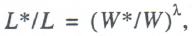
The link between the four market characteristics– demand, supply, actual and equilibrium prices–for the labor market is given by the following relation [3]:
 (10)
(10)
where λ is a parameter characterizing labor market flexibility, i.e., the mutual adaptability of the “demand–supply” and “equilibrium price–actual price” ratios.
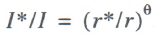
It is easy to see that the labor demand indicator in (10) is missing from (3), while the indicator of the equilibrium price of labor in (10) is not found in (4). By bringing them all together in a single structure (10), Walras’s law (4) and factor price equation (3) can be synthesized into a single theoretical scheme. The scheme is completed when constraint equations for the capital market, similar to (10), are incorporated in it:
 (11)
(11)
where θ is a parameter describing capital market flexibility.
Note that investment demand is not explicitly present in statistical reports. Therefore, in rough–and– ready calculations, it can be estimated by Walras’s law (4), in which except for this variable all the other aggregates are statistically defined. This having been done, model (11) now has its full information content. In what follows we consider the labor market alone as it is better verified, given that similar reasoning is applicable to the capital market also.
As there is always some unemployment on the labor market, we can write down the following relationship: L*/L = Ω. = 1 – ω, where Ω. is employment rate, ω is unemployment rate. Then, using the exploitation index ε, the flexibility parameter of the labor market can be calculated by the simple formula
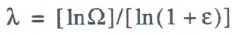 (12)
(12)
Thus, labor market flexibility depends on the prevailing rate of labor exploitation, which ensures the continuity of labor market studies with identified indicators of distortion of macrofactor prices.
Tables 3 and 4 list labor market flexibility figures for the US and Russian economies calculated by formula (12). These figures lead to several conclusions.
Table 3. Characteristics of the US labor market 1987–2000
|
Year |
ω, % |
Ω, % |
λ |
|
1987 |
6.20 |
93.80 |
–0.204 |
|
1988 |
5.50 |
94.50 |
–0.179 |
|
1989 |
5.30 |
94.70 |
–0.181 |
|
1990 |
5.60 |
94.40 |
–0.191 |
|
1991 |
6.80 |
93.20 |
–0.228 |
|
1992 |
7.50 |
92.50 |
–0.237 |
|
1993 |
6.90 |
93.10 |
–0.222 |
|
1994 |
6.10 |
93.90 |
–0.203 |
|
1995 |
5.60 |
94.40 |
–0.195 |
|
1996 |
5.40 |
94.60 |
–0.200 |
|
1997 |
4.90 |
95.10 |
–0.179 |
|
1998 |
4.50 |
95.50 |
–0.155 |
|
1999 |
4.20 |
95.80 |
–0.144 |
|
2000 |
4.00 |
96.00 |
–0.132 |
|
Average |
5.61 |
94.39 |
–0.189 |
Table 4. Characteristics of the Russian labor market 1990–2002
|
Year |
ω, % |
Ω,% |
λ |
|
1990 |
10.36 |
89.64 |
0.140 |
|
1991 |
12.09 |
87.91 |
0.184 |
|
1992 |
5.17 |
94.83 |
0.144 |
|
1993 |
5.71 |
94.29 |
0.216 |
|
1994 |
7.80 |
92.20 |
1.611 |
|
1995 |
9.47 |
90.53 |
0.321 |
|
1996 |
9.66 |
90.34 |
0.843 |
|
1997 |
11.84 |
88.16 |
–1.928 |
|
1998 |
13.22 |
86.78 |
–3.108 |
|
1999 |
12.60 |
87.40 |
0.328 |
|
2000 |
9.79 |
90.21 |
0.302 |
|
2001 |
8.88 |
91.12 |
0.459 |
|
2002 |
8.55 |
91.45 |
0.834 |
|
Average |
9.63 |
90.37 |
0.031 |
First, the response of the Russian labor market is more natural than that of the American one. This is demonstrated by a negative sign of λ for the US economy and a positive sign for the Russian economy (Tables 3 – 4). The negative sign points to a fundamental abnormality, a sort of “inverted” response of the national labor market to distortions of the equilibrium wage.
Thus, contrary to expectations the labor market of advanced Western states is not so proper and efficient. It appears that at the present phase of capitalism in these countries, the logic of the labor market has become much more complex and no longer fits into conventional theoretical schemes. Developing countries and transition economies like Russia, by contrast, still conform to the classical notions of market laws.
Second, the absolute value of labor market flexibility in the United States is on average 6.3 times higher than in Russia. This can be seen from a comparison of the absolute values of λ without regard for sign. Therefore, for all the “propriety” of the Russian labor market this fact ought not to cause any euphoria, because the market sensitiveness is very low, and this to a great extent devalues the correct direction of its response.
Third, the Russian labor market is less predictable than the American one. It follows from a comparison of the dynamic behavior of λ. This indicator varies within the range [–0.23 to –0.13] for the United States and within [–3.11 to –1.61] for Russia. Accordingly, the fluctuation band is approximately 47 times wider for Russia than for the United States. Clearly, given such a wide spread of the adjustment index of the Russian labor market, it is not at all easy to forecast its future behavior.
Thus, even with a correctly directed response of the national labor market to variation in macrofactor prices the efficiency of the market is not yet secured. Correspondingly, the index of labor market flexibility, though an important measure of market efficiency, is not sufficient. Generally, the question of the Russian labor market model vs. the American one is still open.
“Natural” level of unemployment: method of determination and empirical estimates
Though the indicator of labor market flexibility is unstable in time and does not allow direct forecasts of unemployment level, the approach underlying the determination of λ can be used for forecasting. To this end, we believe, it is necessary to ascertain whether or not there is a lasting temporal relationship between employment/unemployment level Ω(ω) and coefficient of distortion of the equilibrium price of labor W*/W.
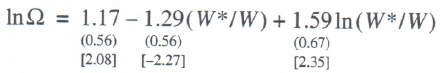
The author build along these lines the following econometric relationship for the US economy 1987 – 2000:
 (13)
(13)
N = 14; R2 = 0.554; F = 6.83; DW = 0.82.
Regression relationship (13) successfully passes all tests, including t–statistics of the regression coefficients at a 90% significance level and can be used in future analyses of the US national labor market. Therefore, there is a stable relationship between the employment level indicators and the equilibrium price distortion coefficient.
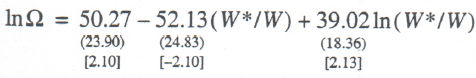
Similar calculations for the Russian economy 1992–2002 led to the following econometric relationship (early years of the original statistical series were rejected because they created hindrances to model calibration):
 (14)
(14)
N =11; R2 = 0.456; F = 3.35; DW = 0.74.
Regression relationship (14) successfully passes all tests, including t–statistics of the regression coefficients at a 90% significance level and can be used in future analyses of the Russian national labor market.
Models (13) – (14) makes it possible not only to predict employment level depending on the price situation on the labor market but also to determine such an interesting measure as “natural” or “normal” level of unemployment. To date, there are several different methods of calculation of this quantity, but they, as a rule, either involved an oversophisticated interpretation or complex procedures of identification. We propose the following alternative scheme.
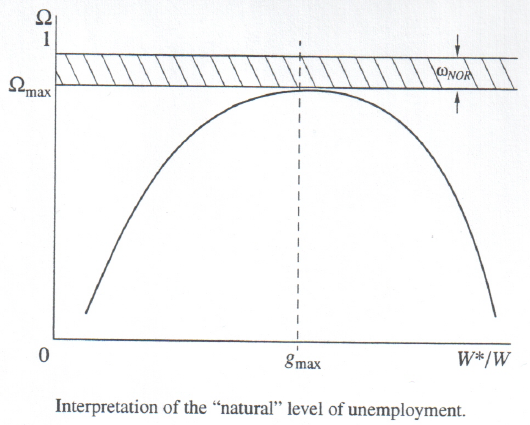
The ration Ω = Ω(g), where g = W*/W, determined by functions (13)–(14), is nonlinear, of parabolic form. The maximum point for the price distortion indicator gmax, when dΩ/dg = 0, is uniquely determined by the parameters of regressions (13)–(14). The peak employment point Ωmax = Ω(gmax) corresponds to this point. However, this point does not, as a rule, equal unity. Consequently, even under the most favorable circumstances, there will no full employments on the labor market. Then, the gap between full employment and peak employment will reflect the level of “natural” unemployment ωNOR, which is calculated from the formula
 (15)
(15)
A graphic form of this interpretation is given in the figure below.
Calculations show that for the United States gmax = 0.75, to which there corresponds peak employment Ωmax = 0.95. Accordingly, the “natural” level of unemployment for the United States is ωNOR = 5%. For Russia similar calculations produce the value of the point gmax = 1.23, to which there corresponds peak employments Ωmax = 0.92. Hence, the “natural” level of unemployment for Russia is ωnor = 8%, which is 3% higher than for the United States.
These results demonstrate once again that price distortion does not of itself decide the issue of macromarket efficiency. The United States, which has unnatural price rations on the labor market, has built an economic system with lower “natural” unemployment than Russia has, which featured the “classical” model of the labor market.
Note that a comparison of the values of gmax with the actual figures of the labor market price distortion coefficient (see Tables 1–2) shows a rather great difference also in the operational properties between the US and Russian market markets. For example, for the Unites States, the actual data of the labor market price distortion coefficient were always within the small neighborhood of gmax, while in the case of Russia they departed from it at extremely great distances. Thus, the American labor market was very well adjusted to its optimum state and gravitated toward it, whereas Russia was in a stochastic oscillation regime with any noticeable sensibility to the optimum point.
Methodological summary
Equilibrium is a fundamental notion in modem economic theory. It extends to prices as well. As a consequence, economic analysis makes much of disequilibrium states and of deviations of actual prices from equilibrium ones. However, an attempt to apply these notions to labor and capital markets by using simple constructs showed that the concept of equilibrium is much more complex than generally believed. For the United States, in particular, the optimum ratio of equilibrium and actual wage is W*/W = 0.75, and for Russia, W*/W = 1.23. In both cases the deviation from the classical ideal is about the same: W*/W = 1.0. Thus, our notion of price equilibrium should be revised. It transpires that every country arrives at its own equilibrium relation between marginal labor productivity and actual wage. Our calculations suggest the following regularity: the richer a country and the higher its level of economic development, the higher is the likelihood of right–hand deviation of the equilibrium (optimum) state W*/W from unity (which is the case in the United States); for poorer countries with an insufficient economic potential, W*/W tends to the left of unity (which is the case in Russia). Hence, the classical notions of the patterns of formation of the equilibrium prices of labor and capital should be adjusted for this fact.
The existence of a bias, W*/W, relative to the unity mark perfectly fits into Yu. V. Yaremenko’s theory of multilevel economy [9]. In fact, the reference here is to its labor market application. The richer and more technologically advanced a country, the more successfully it overcomes the traditional labor market mechanisms, until at some point an inverse relation is established between demand and supply L*/L and between equilibrium and actual compensation W*/W.
The discovered pattern of development of the world economy is not unique. On the contrary, examples of such effects are accumulating. They include the well–known B. Balassa effect, where the relationship of currency rate and purchasing power parity depends on the relative standard of living of a country in question [10]. This effect has already been used to revise the mechanism of formation of currency rate and refine its long–term dynamics [11]. It appears that this methodological device by virtue of its fruitfulness may become widely applied to the analysis of various economic phenomena.
References
1. V. Smirnov, “On the Level of Exploitation of Man in Different Types of Economy,” Obshch. Ekon., No. 3 (2003).
2. E. V. Balatskii, “Cost Imbalances in the Labor Market,” Ekon. Mat. Metody, No. 1 (1993).
3. E. V. Balatskii, “Labor Market Flexibility: A Macroeconomic Evaluation,” Mirovaya Ekon. Mezhdunar. Otnosh., No. 2 (1998).
4. M. L. Veitsman, “A Deficiency Syndrome Model,” Ekon. Mat. Metody, No. 6 (1990).
5. www.bea.gov (Official Website of the US Bureau of Economic Analysis).
6. www.bls.gov (Official Website of the US Bureau of Labor Statistics).
7. Russian Statistical Yearbooks: A Data Book (Goskomstat Rossii, Moscow, 1995) [in Russian].
8. Russian Statistical Yearbook: A Data Book (Goskomstat Rossii, Moscow, 2000) [in Russian].
9. Yu. V. Yaremenko, Theory and Methodology of the Study of a Multilevel Economy (Nauka, Moscow, 1997) [in Russian].
10. V. A. Volkonskii and A. I. Kuzovkin, “Price Disparities in Russia and World–Wide,” Probl. Prognozir. 12 (6) (2002) [Stud. Russ. Econ. Dev. 12 (6) (2002)].
11. E. V. Balatskii and A. V. Serebrennikov, “New Instrumental Imperatives in Exchange Rate Modeling,” Vestn. Mosk. Univ. Ser. 6: Ekon., No. 5 (2003).
[1] The author is greatly indebted to A. B. Gusev for his help in collecting statistics and making calculations. The input data for calculations were the dynamic series of respective deflated indicators of official statistical digests and web–sites of the United States and Russia [5–8]. The author also thanks Yu. V. Kuznetsov for his valuable comments.
[2] Although our calculations by model (9) can be considered satisfactory in terms of accuracy, in 1997–1998, there was some abnormality in the estimated values of distortion of macrofactor prices (the indicators ε and μ turned out to have different signs in Table 2). The reasons is the 1998 currency and debt crisis, which made the Russian economy unprofitable and disturbed the natural line of the dynamic series of the clean profit indicator.
[3] It should be mentioned that in Russia, the profit and labor cost aggregates figuring in accounting reports do not match the respective economic notions. As often as not, return on capital is reported with wages, which somewhat distorts final quantitative results. However, this circumstance not only leaves the conclusions were arrived at in this study unaffected, but on the contrary, renders them extra valid. Thus, at a first approximation, this scheme can be considered quite operable even for the Russian context.
[4] Calculations done for the British economy yielded results very similar to those obtained for the US economy. This fact alone suggests a lasting pattern of labor overpayment in developed countries.
Official link to the article:
Balatskii E.V. Distortion of Equilibrium Prices on Macrofactor Markets// «Studies on Russian Economic Development». Vol.16. No.3. 2005, pp. 304–311.